## Line Chart: Attention over Values, a=24
### Overview
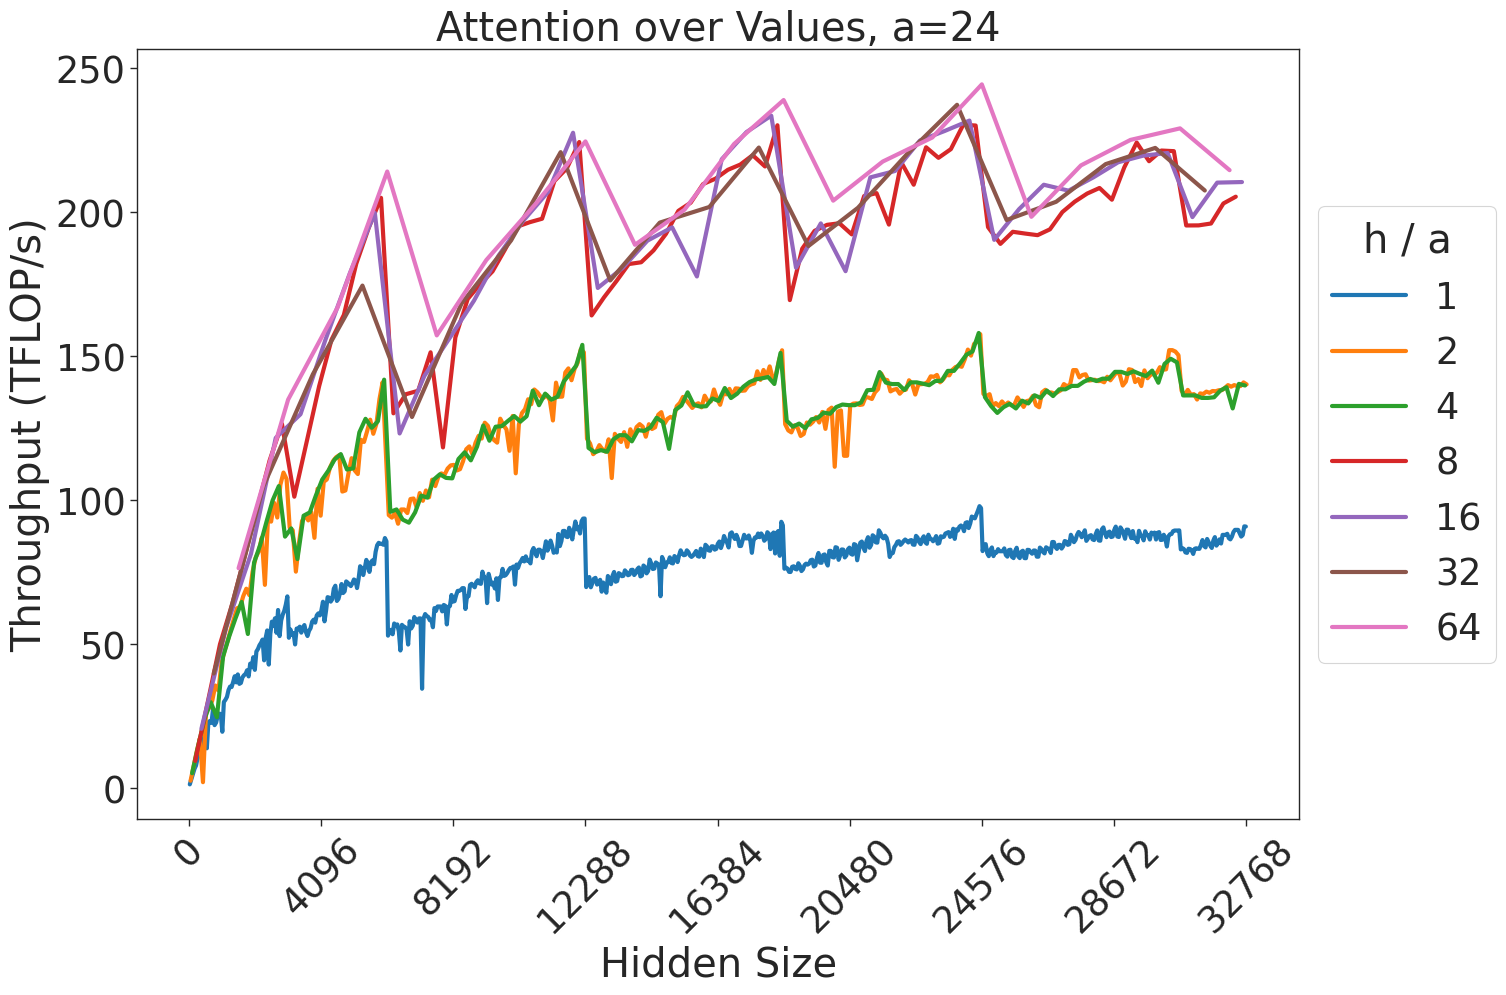
This chart illustrates the performance throughput (measured in TFLOP/s) of an attention mechanism operation as a function of "Hidden Size." The data is segmented by the ratio "h / a" (heads divided by the attention parameter 'a'). The chart demonstrates a general upward trend in throughput as the hidden size increases, punctuated by periodic, sharp performance drops (sawtooth pattern), likely indicating hardware or memory alignment constraints.
### Components/Axes
* **Title:** "Attention over Values, a=24" (Centered at the top).
* **X-Axis:** Labeled "Hidden Size". The scale ranges from 0 to 32768. Major tick marks are provided at intervals of 4096 (0, 4096, 8192, 12288, 16384, 20480, 24576, 28672, 32768).
* **Y-Axis:** Labeled "Throughput (TFLOP/s)". The scale ranges from 0 to 250. Major tick marks are provided at intervals of 50 (0, 50, 100, 150, 200, 250).
* **Legend:** Positioned on the right side of the chart. The title is "h / a". The legend maps colors to specific ratios:
* **Blue:** 1
* **Orange:** 2
* **Green:** 4
* **Red:** 8
* **Purple:** 16
* **Brown:** 32
* **Pink:** 64
### Detailed Analysis
The data series are grouped into three distinct performance tiers based on the "h / a" ratio.
**1. Trend Verification:**
* **General Trend:** All seven lines exhibit a steep, non-linear increase in throughput from 0 to ~4096 hidden size, followed by a slower, oscillating growth trend as hidden size increases toward 32768.
* **Sawtooth Pattern:** Every line displays periodic, sharp vertical drops. These drops occur at consistent intervals along the x-axis, suggesting performance "cliffs" related to memory alignment, cache boundaries, or tiling strategies in the underlying compute kernel.
**2. Data Series Grouping:**
* **Bottom Tier (Blue, h/a=1):** This line is the lowest performer, consistently staying below 100 TFLOP/s. It peaks near 90-95 TFLOP/s at the highest hidden sizes.
* **Middle Tier (Orange, h/a=2; Green, h/a=4):** These two lines are tightly coupled and overlap significantly. They show a clear performance advantage over the blue line, peaking between 140 and 150 TFLOP/s.
* **Top Tier (Red, h/a=8; Purple, h/a=16; Brown, h/a=32; Pink, h/a=64):** These four lines are clustered closely together at the top of the chart. They exhibit the highest throughput, frequently reaching peaks between 220 and 245 TFLOP/s. The Pink line (64) often occupies the highest position within this cluster.
**3. Approximate Values:**
* **At Hidden Size ~4096:**
* Blue: ~60 TFLOP/s
* Orange/Green: ~100 TFLOP/s
* Top Cluster: ~150-170 TFLOP/s
* **At Hidden Size ~32768:**
* Blue: ~90 TFLOP/s
* Orange/Green: ~140 TFLOP/s
* Top Cluster: ~210-220 TFLOP/s
### Key Observations
* **Diminishing Returns:** While increasing the "h/a" ratio from 1 to 8 provides a significant jump in throughput, increasing the ratio further (from 8 to 64) yields marginal gains, as the lines for 8, 16, 32, and 64 are tightly packed.
* **Performance Cliffs:** The periodic drops are synchronized across all lines, indicating that the hardware constraint causing these drops is independent of the "h/a" ratio and is likely tied to the "Hidden Size" parameter itself (e.g., memory bank conflicts or tile size limits).
* **Saturation:** The throughput appears to be approaching a saturation point or a hardware limit, as the slope of the curves flattens significantly after a hidden size of 16384.
### Interpretation
This chart is a classic performance profile of a GPU-accelerated attention kernel (likely FlashAttention or a similar optimized implementation).
* **The "a=24" context:** This likely refers to a fixed head dimension or a specific hardware-related constant.
* **The "h/a" ratio:** This represents the number of attention heads relative to the attention parameter. The data suggests that higher head counts (relative to the parameter) are significantly more efficient, likely due to better occupancy of the GPU's compute units.
* **The Sawtooth Pattern:** This is a hallmark of GPU kernel performance. When the "Hidden Size" increases, the kernel likely switches between different tiling strategies or memory access patterns. When the hidden size hits a boundary (e.g., a multiple of the warp size or shared memory capacity), the kernel may be forced to use a less efficient execution path, causing the sudden drop in TFLOP/s.
* **Conclusion:** For optimal performance, developers should aim for an "h/a" ratio of at least 8. Increasing the ratio beyond 8 provides minimal throughput benefits, suggesting that the compute resources are already well-utilized at that point.