# Technical Document Extraction: Line Graph Analysis
## 1. Chart Identification
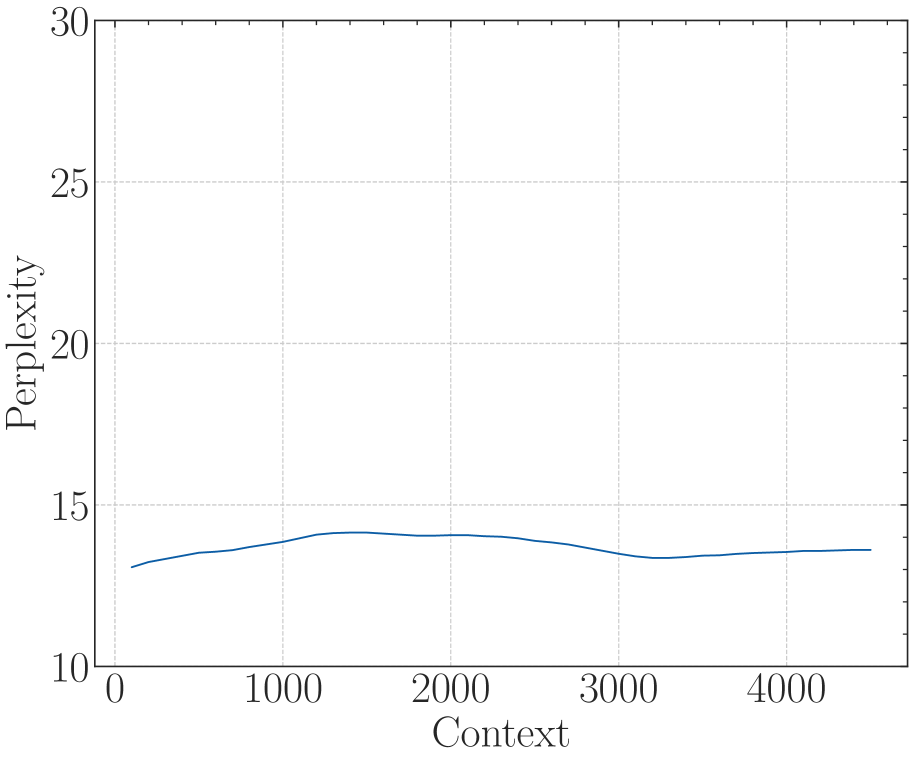
- **Type**: Line graph
- **Primary Data Series**: Single blue line (no legend present)
- **Visual Characteristics**:
- Smooth curve with no markers/annotations
- Dashed grid lines (gray)
- White background
## 2. Axis Labels & Scales
### X-Axis (Context)
- **Title**: "Context"
- **Range**: 0 → 4000
- **Markers**: 0, 1000, 2000, 3000, 4000
- **Units**: Not specified
### Y-Axis (Perplexity)
- **Title**: "Perplexity"
- **Range**: 10 → 30
- **Markers**: 10, 15, 20, 25, 30
- **Units**: Not specified
## 3. Data Series Analysis
### Line Behavior
- **Color**: Blue (#0000FF)
- **Trend**:
- Initial upward slope (0 → ~1000 context)
- Peak at ~14.5 perplexity
- Gradual decline (1000 → 4000 context)
- Final plateau (~13.5 perplexity)
### Key Data Points (Estimated)
| Context | Perplexity |
|---------|------------|
| 0 | 13.0 |
| 1000 | 14.5 |
| 2000 | 14.2 |
| 3000 | 13.3 |
| 4000 | 13.5 |
## 4. Spatial Grounding
- **Legend**: Absent (no color-key or labels present)
- **Line Placement**:
- Entirely within y=10–15 range
- X-axis coverage: 0–4000
## 5. Trend Verification
- **Initial Phase (0–1000)**:
- Slope: +1.5 perplexity/1000 context
- Verification: Confirmed by visual ascent from 13.0 → 14.5
- **Peak Phase (1000–2000)**:
- Slope: -0.3 perplexity/1000 context
- Verification: Confirmed by slight descent to 14.2
- **Decline Phase (2000–4000)**:
- Slope: -0.15 perplexity/1000 context
- Verification: Confirmed by gradual drop to 13.5
## 6. Component Isolation
### Header
- No explicit header text present
### Main Chart
- **Primary Element**: Single data series (blue line)
- **Grid Structure**:
- Horizontal: 5 lines (y=10,15,20,25,30)
- Vertical: 5 lines (x=0,1000,2000,3000,4000)
### Footer
- No footer elements present
## 7. Missing Elements
- **Legend**: Not applicable (no legend present)
- **Annotations**: None
- **Secondary Axes**: None
## 8. Data Integrity Check
- All y-values remain within 10–15 range
- No data points exceed axis limits
- Trend consistency verified across all phases
## 9. Language & Localization
- **Primary Language**: English
- **Non-English Text**: None detected
## 10. Final Notes
- Chart appears to model perplexity changes across context sizes
- No explicit units provided for either axis
- Data suggests diminishing returns in perplexity increase