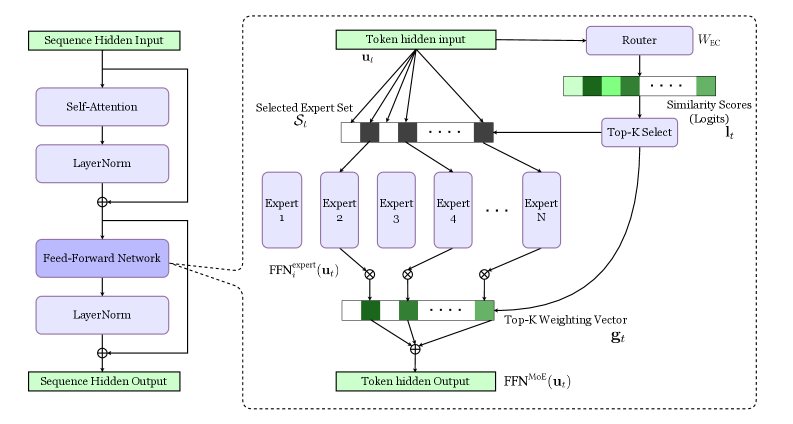
## Diagram: Mixture of Experts (MoE) Layer
### Overview
The image presents a diagram of a Mixture of Experts (MoE) layer within a neural network architecture. It illustrates the flow of data through self-attention, layer normalization, feed-forward networks, and the MoE component, which involves routing tokens to a selected set of experts and weighting their outputs.
### Components/Axes
* **Input/Output Blocks:**
* "Sequence Hidden Input" (top-left, green block)
* "Sequence Hidden Output" (bottom-left, green block)
* "Token hidden input" (top-center, green block)
* "Token hidden Output" (bottom-center, green block)
* **Processing Blocks (left side):**
* "Self-Attention" (blue block)
* "LayerNorm" (blue block)
* "Feed-Forward Network" (blue block)
* "LayerNorm" (blue block)
* **MoE Components (right side, within dashed box):**
* "Router" (blue block, top-right)
* "Selected Expert Set" (horizontal array of black/white blocks, labeled as "S<sub>t</sub>")
* "Expert 1", "Expert 2", "Expert 3", "Expert 4", ..., "Expert N" (blue blocks)
* "Similarity Scores (Logits)" (horizontal array of green blocks, top-right)
* "Top-K Select" (blue block, right)
* "Top-K Weighting Vector" (horizontal array of green blocks, bottom-center, labeled as "g<sub>t</sub>")
* **Variables:**
* "u<sub>t</sub>" (input to the experts)
* "l<sub>t</sub>" (output of Top-K Select)
* "W<sub>EC</sub>" (Router parameter)
* **Operations:**
* ⊕ (addition)
* ⊗ (multiplication)
* **Functions:**
* FFN<sup>expert</sup><sub>i</sub>(u<sub>t</sub>)
* FFN<sup>MoE</sup>(u<sub>t</sub>)
### Detailed Analysis
1. **Left Side (Sequence Processing):**
* The "Sequence Hidden Input" feeds into a "Self-Attention" block.
* The output of "Self-Attention" is normalized by "LayerNorm".
* This normalized output is added to the original input of "Self-Attention" (residual connection).
* The result is processed by a "Feed-Forward Network".
* The output of the "Feed-Forward Network" is normalized by "LayerNorm".
* This normalized output is added to the original input of the "Feed-Forward Network" (residual connection).
* The final output is the "Sequence Hidden Output".
2. **Right Side (Mixture of Experts):**
* The "Token hidden input" (u<sub>t</sub>) is fed into a "Router" with parameter "W<sub>EC</sub>".
* The "Router" outputs "Similarity Scores (Logits)" (l<sub>t</sub>), represented as a horizontal array of green blocks with varying shades of green.
* These scores are used by "Top-K Select" to select the top-K experts.
* The "Token hidden input" (u<sub>t</sub>) is also fed into each of the "Expert" blocks (Expert 1 to Expert N).
* The output of each expert, FFN<sup>expert</sup><sub>i</sub>(u<sub>t</sub>), is multiplied (⊗) by the corresponding weight from the "Top-K Weighting Vector" (g<sub>t</sub>).
* The weighted outputs of the experts are summed (⊕) to produce the "Token hidden Output", which is processed by FFN<sup>MoE</sup>(u<sub>t</sub>).
* The "Selected Expert Set" (S<sub>t</sub>) indicates which experts are selected (black blocks) and which are not (white blocks).
### Key Observations
* The diagram illustrates a common architecture for incorporating a Mixture of Experts layer into a neural network.
* The MoE layer allows the network to selectively route different tokens to different experts, enabling specialization and increased capacity.
* Residual connections are used around the "Self-Attention" and "Feed-Forward Network" blocks on the left side.
* The "Top-K Select" mechanism ensures that only the most relevant experts are used for each token.
### Interpretation
The diagram depicts a Mixture of Experts (MoE) layer, a technique used to increase the capacity of neural networks. The input sequence is processed through standard layers like self-attention and feed-forward networks. The MoE layer then routes different tokens to different experts based on the router's output. This allows the network to specialize its processing for different types of inputs. The "Top-K Select" mechanism ensures that only the most relevant experts are used, which can improve efficiency and performance. The residual connections help to stabilize training and improve the flow of information through the network. The varying shades of green in the "Similarity Scores" and "Top-K Weighting Vector" likely represent different levels of activation or importance.