## Diagram: Deep-Thinking Regime with JSD Threshold Analysis
### Overview
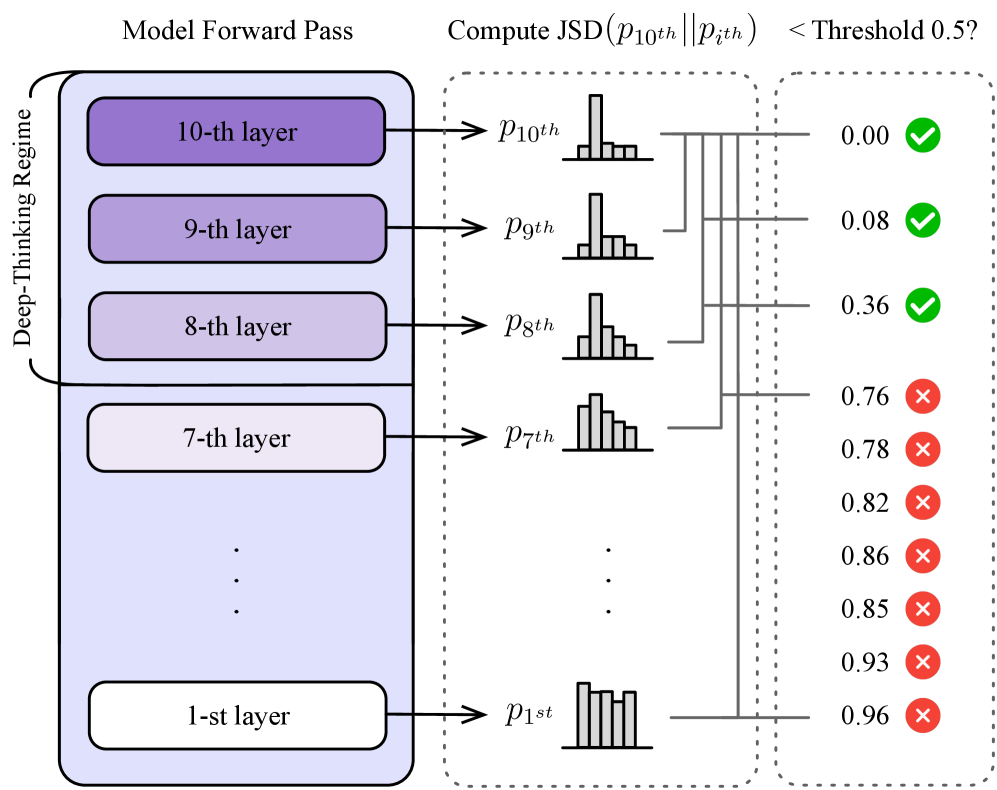
The diagram illustrates a multi-layered "Deep-Thinking Regime" (1st to 10th layers) where each layer generates a probability distribution (`p1st` to `p10th`). A Jensen-Shannon Divergence (JSD) calculation compares the 10th layer's distribution (`p10th`) against all other layers (`pith`). Results are evaluated against a threshold of 0.5, with green checks (✓) for values below the threshold and red crosses (✗) for values above.
---
### Components/Axes
1. **Left Panel: Deep-Thinking Regime**
- Vertical stack of 10 layers (1st to 10th), labeled with their respective layer numbers.
- Each layer outputs a probability distribution (`p1st` to `p10th`), represented as histograms.
- Layers are color-coded: darker purple for higher layers (10th–8th), lighter purple for lower layers (7th–1st).
2. **Middle Panel: JSD Computation**
- Title: "Compute JSD(p₁₀ᵗʰ || pᵢᵗʰ)".
- Vertical axis lists `p10th` to `p1st` (top to bottom).
- Horizontal axis shows JSD values (0.00 to 0.96) with incremental markers (0.00, 0.08, 0.36, etc.).
- Dotted lines connect `p10th` to each `pith` for visual comparison.
3. **Right Panel: Threshold Evaluation**
- Title: "< Threshold 0.5?".
- Vertical axis lists JSD values (0.00, 0.08, 0.36, 0.76, 0.78, 0.82, 0.86, 0.85, 0.93, 0.96).
- Green checks (✓) for values < 0.5; red crosses (✗) for values ≥ 0.5.
---
### Detailed Analysis
1. **Layer Outputs (Left Panel)**
- All layers show distinct histogram distributions, with no explicit numerical values provided for individual bins.
2. **JSD Values (Middle Panel)**
- **p10th vs. p10th**: JSD = 0.00 (✓).
- **p10th vs. p9th**: JSD = 0.08 (✓).
- **p10th vs. p8th**: JSD = 0.36 (✓).
- **p10th vs. p7th**: JSD = 0.76 (✗).
- **p10th vs. p6th**: JSD = 0.78 (✗).
- **p10th vs. p5th**: JSD = 0.82 (✗).
- **p10th vs. p4th**: JSD = 0.86 (✗).
- **p10th vs. p3th**: JSD = 0.85 (✗).
- **p10th vs. p2th**: JSD = 0.93 (✗).
- **p10th vs. p1st**: JSD = 0.96 (✗).
3. **Threshold Evaluation (Right Panel)**
- Values < 0.5 (0.00, 0.08, 0.36) are marked with green checks (✓).
- Values ≥ 0.5 (0.76–0.96) are marked with red crosses (✗).
---
### Key Observations
1. **Trend in JSD Values**:
- Higher layers (10th, 9th, 8th) exhibit significantly lower JSD values compared to lower layers (7th–1st).
- JSD increases monotonically as layers descend from 10th to 1st.
2. **Threshold Compliance**:
- Only the top 3 layers (10th, 9th, 8th) meet the JSD threshold (< 0.5).
- All lower layers (7th–1st) exceed the threshold, indicating greater divergence from `p10th`.
3. **Distribution Similarity**:
- The 10th layer is perfectly aligned with itself (JSD = 0.00).
- The 9th and 8th layers show moderate similarity (JSD = 0.08, 0.36), while lower layers diverge sharply.
---
### Interpretation
1. **Model Performance**:
- The top 3 layers (10th–8th) demonstrate strong alignment with the 10th layer's distribution, suggesting they are critical for maintaining consistency in the "Deep-Thinking Regime."
- Lower layers (7th–1st) exhibit poor alignment, potentially indicating instability or inefficiency in earlier processing stages.
2. **Threshold Significance**:
- The 0.5 threshold acts as a binary classifier for layer reliability. Layers below this threshold are deemed "acceptable" for similarity to `p10th`, while those above are flagged as outliers.
3. **Structural Implications**:
- The diagram implies a hierarchical dependency: higher layers refine or stabilize outputs from lower layers. The divergence in lower layers may propagate errors upward if not corrected by the top layers.
4. **Anomalies**:
- The 7th layer (JSD = 0.76) is the first to exceed the threshold, marking a critical point where performance degrades.
- The 1st layer (JSD = 0.96) shows the greatest divergence, suggesting foundational layers may require optimization.
---
### Conclusion
This diagram highlights the importance of upper layers in maintaining distributional consistency within the model. The JSD threshold serves as a diagnostic tool to identify layers contributing to stability versus those introducing variability. Addressing the divergence in lower layers could enhance overall model robustness.