## Diagram: Model Forward Pass and JSD Computation
### Overview
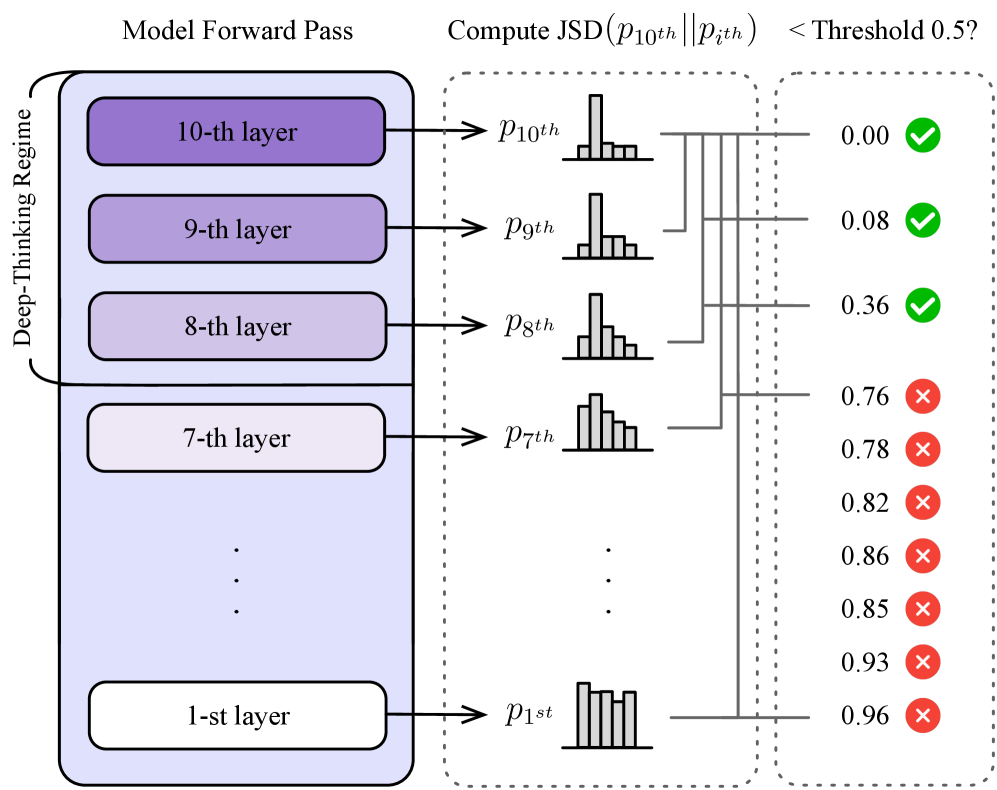
The diagram illustrates a model forward pass through multiple layers, followed by the computation of the Jensen-Shannon Divergence (JSD) between the output of the 10th layer and the output of each individual layer. The diagram also indicates whether the computed JSD is below a threshold of 0.5.
### Components/Axes
* **Left Box:** Represents the "Model Forward Pass" and is labeled "Model Forward Pass" at the top. It contains stacked layers, numbered from 1st to 10th. The top layers are shaded in purple, with the shading becoming lighter towards the bottom. A curved bracket to the left of the layers is labeled "Deep-Thinking Regime".
* **Middle Box:** Represents the "Compute JSD" stage. The title is "Compute JSD (p10th || pith) < Threshold 0.5?". This section shows histograms representing the output distributions (p) of each layer (1st, 7th, 8th, 9th, 10th).
* **Right Box:** Shows the JSD value and a green checkmark or red cross, indicating whether the JSD is below the threshold of 0.5.
### Detailed Analysis
**Model Forward Pass (Left Box):**
* The layers are stacked vertically, with the 10th layer at the top and the 1st layer at the bottom.
* The layers are labeled as "10-th layer", "9-th layer", "8-th layer", "7-th layer", and "1-st layer". There are ellipsis (...) indicating omitted layers between the 7th and 1st layers.
* The "Deep-Thinking Regime" label spans from approximately the 7th layer to the 10th layer.
**Compute JSD (Middle Box):**
* Each layer's output distribution (p) is represented by a small histogram.
* The histograms are labeled as p10th, p9th, p8th, p7th, and p1st, corresponding to the respective layers.
* Gray lines connect each layer to its corresponding histogram and then to the JSD value on the right.
**JSD Comparison (Right Box):**
* The JSD values are listed vertically, corresponding to the layers from top to bottom.
* A green checkmark indicates that the JSD is below 0.5, while a red cross indicates that it is above 0.5.
* The JSD values and their corresponding indicators are:
* p10th: 0.00 (Green Checkmark)
* p9th: 0.08 (Green Checkmark)
* p8th: 0.36 (Green Checkmark)
* p7th: 0.76 (Red Cross)
* p7th: 0.78 (Red Cross)
* (Implied p6th): 0.82 (Red Cross)
* (Implied p5th): 0.86 (Red Cross)
* (Implied p4th): 0.85 (Red Cross)
* (Implied p3th): 0.93 (Red Cross)
* p1st: 0.96 (Red Cross)
### Key Observations
* The JSD values generally increase as you move from the 10th layer to the 1st layer.
* The JSD values for the top three layers (10th, 9th, and 8th) are below the threshold of 0.5, while the JSD values for the remaining layers are above the threshold.
### Interpretation
The diagram suggests that the higher layers of the model (within the "Deep-Thinking Regime") produce output distributions that are more similar to the 10th layer's output distribution, as indicated by the lower JSD values. As the model processes the input through the lower layers, the output distributions diverge more significantly from the 10th layer's output, resulting in higher JSD values. This could indicate that the "Deep-Thinking Regime" is where the model's core representations are formed, and the earlier layers are more focused on lower-level feature extraction. The threshold of 0.5 is used to distinguish between layers that produce similar outputs to the 10th layer and those that do not.