## Diagram: Deep-Thinking Regime Evaluation
### Overview
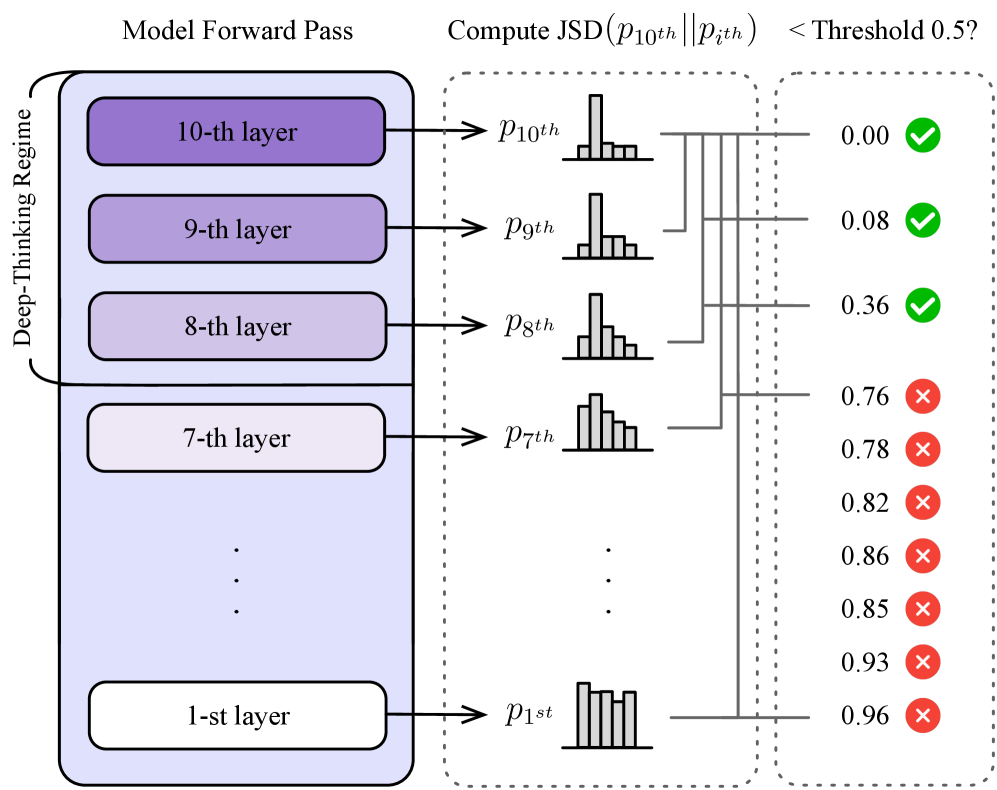
The diagram illustrates a process for evaluating a "Deep-Thinking Regime" within a model, likely a neural network. It shows a forward pass through multiple layers of the model, followed by a computation of the Jensen-Shannon Divergence (JSD) between probability distributions at different layers, and a comparison against a threshold. The diagram visually represents whether the JSD values exceed a threshold of 0.5.
### Components/Axes
The diagram is segmented into three main regions:
1. **Deep-Thinking Regime:** A vertical stack of rectangular blocks representing the layers of the model. Labeled from "10-th layer" at the top to "1-st layer" at the bottom, with an ellipsis indicating intermediate layers.
2. **Compute JSD:** A section showing probability distributions (histograms) corresponding to each layer, and lines connecting them to a JSD computation. The distributions are labeled as *p<sub>10th</sub>*, *p<sub>9th</sub>*, *p<sub>8th</sub>*, *p<sub>7th</sub>*, and *p<sub>1st</sub>*.
3. **Threshold Comparison:** A vertical column of checkmarks and crosses, indicating whether the computed JSD value for each layer is less than or equal to 0.5.
The primary labels are:
* "Model Forward Pass" (above the Deep-Thinking Regime)
* "Compute JSD (*p<sub>10th</sub>* || *p<sub>7th</sub>*)" (above the JSD computation section)
* "< Threshold 0.5?" (above the threshold comparison section)
### Detailed Analysis
The diagram shows the following JSD values and corresponding threshold comparisons:
* **10-th layer:** JSD = 0.00, Result: Checkmark (≤ 0.5)
* **9-th layer:** JSD = 0.08, Result: Checkmark (≤ 0.5)
* **8-th layer:** JSD = 0.36, Result: Checkmark (≤ 0.5)
* **7-th layer:** JSD = 0.76, Result: Cross ( > 0.5)
* **6-th layer:** JSD = 0.78, Result: Cross ( > 0.5)
* **5-th layer:** JSD = 0.82, Result: Cross ( > 0.5)
* **4-th layer:** JSD = 0.86, Result: Cross ( > 0.5)
* **3-rd layer:** JSD = 0.85, Result: Cross ( > 0.5)
* **2-nd layer:** JSD = 0.93, Result: Cross ( > 0.5)
* **1-st layer:** JSD = 0.96, Result: Cross ( > 0.5)
The JSD values generally increase as we move down through the layers (from 10th to 1st). The distributions themselves appear to be histograms, with the x-axis representing the values and the y-axis representing the probability density. The distributions are visually different, suggesting varying data characteristics at each layer.
### Key Observations
* The initial layers (10th, 9th, and 8th) have JSD values below the threshold of 0.5, indicating a high degree of similarity between the probability distributions.
* From the 7th layer onwards, the JSD values consistently exceed the threshold, suggesting a significant divergence in the probability distributions.
* The JSD values increase steadily from the 7th layer to the 1st layer, indicating a growing divergence.
### Interpretation
This diagram likely represents a method for identifying the point at which a model transitions from a "Deep-Thinking Regime" to a state where its internal representations become significantly different. The JSD is used as a metric to quantify this difference. The threshold of 0.5 appears to be a critical value, separating layers that maintain a consistent internal representation from those that diverge.
The increasing JSD values as we move down the layers suggest that the lower layers of the model are processing information in a fundamentally different way than the higher layers. This could be due to the model learning more abstract or complex features in the lower layers, or it could indicate a loss of information or a shift in the model's focus.
The diagram implies that the 7th layer is a key transition point, marking the beginning of the divergence. This information could be used to optimize the model's architecture or training process to maintain a more consistent internal representation throughout all layers. The use of JSD suggests that the goal is to maintain similarity in the *shape* of the probability distributions, rather than simply matching the values themselves.