# Technical Document Extraction: Perplexity vs. Context Graph
## Axis Labels
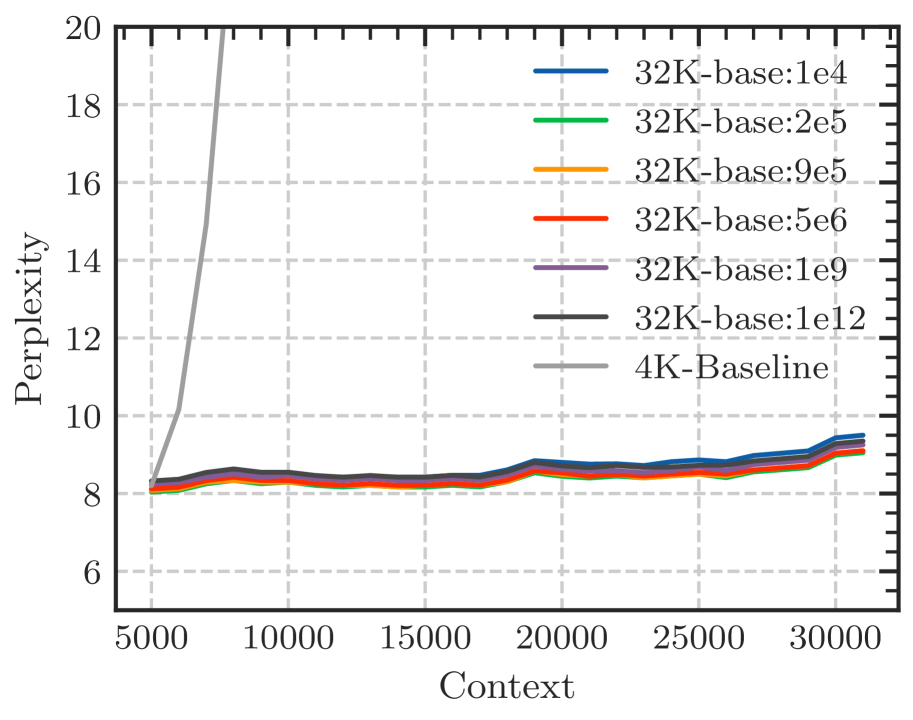
- **Y-Axis**: "Perplexity" (values: 6, 8, 10, 12, 14, 16, 18, 20)
- **X-Axis**: "Context" (values: 5000, 10000, 15000, 20000, 25000, 30000)
## Legend
The legend is positioned on the **right side** of the graph. Each line is color-coded with the following labels:
1. **Blue**: 32K-base:1e4
2. **Green**: 32K-base:2e5
3. **Orange**: 32K-base:9e5
4. **Red**: 32K-base:5e6
5. **Purple**: 32K-base:1e9
6. **Black**: 32K-base:1e12
7. **Gray**: 4K-Baseline
## Line Trends and Data Points
### 1. **4K-Baseline (Gray Line)**
- **Trend**: Sharp upward spike at the start (x ≈ 5000, y ≈ 18), followed by a rapid decline to stabilize around **y ≈ 8** for x > 10,000.
- **Key Data Points**:
- x = 5000: y ≈ 18
- x = 10,000: y ≈ 8
- x = 30,000: y ≈ 8.5
### 2. **32K-base:1e4 (Blue Line)**
- **Trend**: Slightly fluctuates between **y ≈ 8.2–8.8** across the entire x-axis.
- **Key Data Points**:
- x = 5000: y ≈ 8.2
- x = 10,000: y ≈ 8.5
- x = 30,000: y ≈ 8.8
### 3. **32K-base:2e5 (Green Line)**
- **Trend**: Similar to blue line, with minor fluctuations between **y ≈ 8.1–8.7**.
- **Key Data Points**:
- x = 5000: y ≈ 8.1
- x = 10,000: y ≈ 8.4
- x = 30,000: y ≈ 8.7
### 4. **32K-base:9e5 (Orange Line)**
- **Trend**: Slightly higher than green line, fluctuating between **y ≈ 8.3–8.9**.
- **Key Data Points**:
- x = 5000: y ≈ 8.3
- x = 10,000: y ≈ 8.6
- x = 30,000: y ≈ 8.9
### 5. **32K-base:5e6 (Red Line)**
- **Trend**: Slightly higher than orange line, fluctuating between **y ≈ 8.4–9.0**.
- **Key Data Points**:
- x = 5000: y ≈ 8.4
- x = 10,000: y ≈ 8.7
- x = 30,000: y ≈ 9.0
### 6. **32K-base:1e9 (Purple Line)**
- **Trend**: Slightly higher than red line, fluctuating between **y ≈ 8.5–9.1**.
- **Key Data Points**:
- x = 5000: y ≈ 8.5
- x = 10,000: y ≈ 8.8
- x = 30,000: y ≈ 9.1
### 7. **32K-base:1e12 (Black Line)**
- **Trend**: Slightly higher than purple line, fluctuating between **y ≈ 8.6–9.2**.
- **Key Data Points**:
- x = 5000: y ≈ 8.6
- x = 10,000: y ≈ 8.9
- x = 30,000: y ≈ 9.2
## Observations
- The **4K-Baseline** (gray) exhibits a unique sharp spike at the start, unlike the 32K-base lines, which remain relatively flat.
- All 32K-base lines (blue, green, orange, red, purple, black) show minimal variation, clustering tightly between **y ≈ 8–9.5**.
- The **32K-base:1e12** (black) line is the highest among the 32K-base series, while the **32K-base:1e4** (blue) is the lowest.
## Spatial Grounding
- **Legend Position**: Right side of the graph.
- **Color Consistency**: All lines match their legend labels (e.g., blue = 32K-base:1e4, gray = 4K-Baseline).
## Conclusion
The graph compares perplexity across different 32K-base configurations and a 4K baseline. The 4K baseline shows a distinct initial spike, while 32K-base configurations exhibit stable, low perplexity values with minor variations based on base magnitude.