## Line Chart: Lengths of Reasoning cycles
### Overview
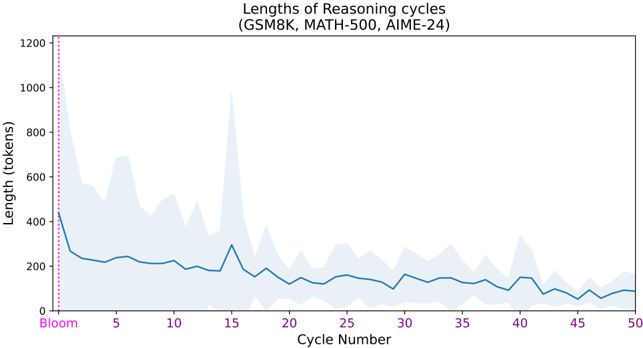
The image is a line chart displaying the lengths of reasoning cycles for a model, likely a large language model, across a series of cycles. The chart title indicates the data is derived from GSM8K, MATH-500, and AIME-24 datasets. The x-axis represents the cycle number, and the y-axis represents the length in tokens. A shaded region around the line indicates variability or uncertainty.
### Components/Axes
* **Title:** Lengths of Reasoning cycles (GSM8K, MATH-500, AIME-24)
* **X-axis:** Cycle Number, with markers at 0, 5, 10, 15, 20, 25, 30, 35, 40, 45, and 50.
* **Y-axis:** Length (tokens), with markers at 0, 200, 400, 600, 800, 1000, and 1200.
* **Data Series:** A single blue line representing the length of reasoning cycles. A light blue shaded area surrounds the line, indicating a confidence interval or standard deviation.
* **Vertical Line:** A vertical dotted magenta line is present at x=0, labeled "Bloom" in magenta.
### Detailed Analysis
* **Data Series Trend:** The blue line starts at approximately 420 tokens at cycle 0 (Bloom). It initially decreases sharply to around 230 tokens by cycle 3. From cycle 3 to cycle 50, the line generally fluctuates between 100 and 250 tokens, with some peaks and valleys. There is a notable peak around cycle 16, reaching approximately 280 tokens. The line ends at approximately 90 tokens at cycle 50.
* **Shaded Region:** The light blue shaded region around the blue line is wider at the beginning of the chart (around cycle 0) and near cycle 16, indicating greater variability in the length of reasoning cycles at these points. The shaded region narrows as the cycle number increases, suggesting more consistent reasoning cycle lengths in later cycles.
* **Bloom Line:** The vertical magenta dotted line at x=0, labeled "Bloom", likely represents the initial state or a specific configuration of the model.
### Key Observations
* The length of reasoning cycles decreases significantly in the initial cycles after "Bloom".
* The variability in reasoning cycle lengths is higher in the early cycles and around cycle 16.
* The reasoning cycle lengths tend to stabilize and become more consistent as the cycle number increases.
### Interpretation
The chart suggests that the model's reasoning process, as measured by the length of reasoning cycles, undergoes an initial period of adjustment after the "Bloom" state. The decreasing length of reasoning cycles in the early cycles may indicate that the model is learning to solve problems more efficiently. The higher variability in the early cycles and around cycle 16 could be due to the model encountering more challenging or ambiguous problems during these periods. The stabilization of reasoning cycle lengths in later cycles suggests that the model has reached a more consistent and stable state in its reasoning process. The datasets used (GSM8K, MATH-500, AIME-24) are all mathematical problem-solving datasets, so the reasoning cycles likely represent the steps the model takes to solve these problems.