\n
## Line Chart: Lengths of Reasoning Cycles
### Overview
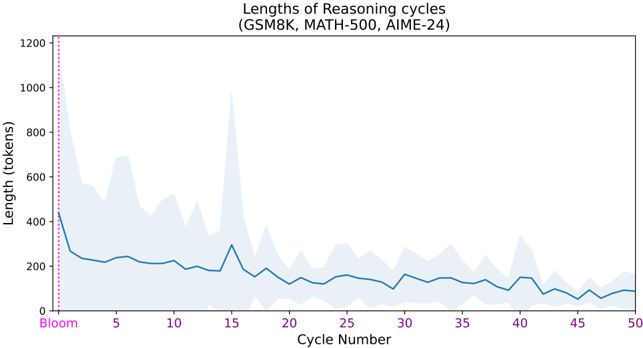
The image presents a line chart illustrating the relationship between Cycle Number and Length of Reasoning Cycles (measured in tokens). The chart appears to represent data from models GSM8K, MATH-500, and AIME-24, as indicated in the title. A shaded region around the line represents a confidence interval or standard deviation. A vertical dashed line is present at Cycle Number 0, labeled "Bloom".
### Components/Axes
* **Title:** "Lengths of Reasoning cycles (GSM8K, MATH-500, AIME-24)" - positioned at the top-center of the chart.
* **X-axis:** "Cycle Number" - ranging from 0 to 50, with tick marks at intervals of 5.
* **Y-axis:** "Length (tokens)" - ranging from 0 to 1200, with tick marks at intervals of 200.
* **Data Series:** A single blue line representing the average length of reasoning cycles.
* **Shaded Region:** A light blue area surrounding the line, indicating variability or confidence interval.
* **Vertical Line:** A dashed purple line at x=0, labeled "Bloom".
* **No Legend:** The chart does not have a separate legend, as there is only one data series.
### Detailed Analysis
The blue line representing the average length of reasoning cycles initially decreases sharply from Cycle Number 0 to approximately Cycle Number 5. After this initial drop, the line fluctuates, exhibiting several peaks and valleys, before generally trending downwards towards Cycle Number 50.
Here's an approximate extraction of data points, noting the inherent uncertainty in reading values from the chart:
* **Cycle 0 (Bloom):** Length ≈ 800 tokens
* **Cycle 5:** Length ≈ 200 tokens
* **Cycle 10:** Length ≈ 250 tokens
* **Cycle 15:** Length ≈ 600 tokens
* **Cycle 20:** Length ≈ 300 tokens
* **Cycle 25:** Length ≈ 200 tokens
* **Cycle 30:** Length ≈ 150 tokens
* **Cycle 35:** Length ≈ 180 tokens
* **Cycle 40:** Length ≈ 130 tokens
* **Cycle 45:** Length ≈ 100 tokens
* **Cycle 50:** Length ≈ 100 tokens
The shaded region indicates that the length of reasoning cycles varies significantly around the average. The width of the shaded region appears to be wider during the initial cycles (0-10) and around Cycle 15, suggesting greater variability in these regions.
### Key Observations
* The most significant drop in reasoning cycle length occurs within the first 5 cycles.
* There is a notable peak in reasoning cycle length around Cycle 15.
* The reasoning cycle length generally decreases over the observed 50 cycles, but with considerable fluctuation.
* The "Bloom" marker at Cycle 0 indicates a starting point or initial condition.
### Interpretation
The chart suggests that the length of reasoning cycles decreases as the process iterates, potentially indicating that the model becomes more efficient at reasoning over time. The initial sharp decrease could represent a period of rapid learning or adaptation. The fluctuations and peak around Cycle 15 might indicate periods of increased complexity or difficulty in the reasoning process. The models GSM8K, MATH-500, and AIME-24 are likely being used to solve problems, and the chart shows how the length of the reasoning process changes as the model iterates towards a solution. The "Bloom" marker likely represents the initial state of the model before any reasoning cycles have been performed. The decreasing trend suggests that the model is converging towards a more concise and efficient reasoning process. The variability, as shown by the shaded region, indicates that the reasoning process is not always consistent and can vary depending on the specific problem or context.