## Line Graph: Lengths of Reasoning cycles (GSM8K, MATH-500, AIME-24)
### Overview
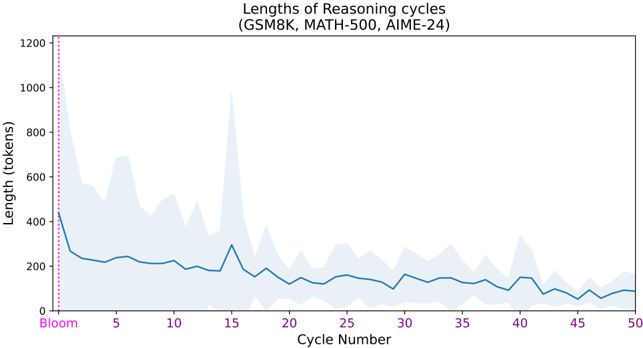
The graph depicts the evolution of reasoning cycle lengths (in tokens) across 50 cycles for three datasets: GSM8K, MATH-500, and AIME-24. A vertical dashed line labeled "Bloom" marks cycle number 5. The line fluctuates significantly, with an initial sharp decline, a peak at cycle 15, and gradual stabilization toward cycle 50.
### Components/Axes
- **X-axis**: "Cycle Number" (0 to 50, increments of 5).
- **Y-axis**: "Length (tokens)" (0 to 1200, increments of 200).
- **Legend**:
- "Bloom" (pink dashed vertical line at cycle 5).
- Line color: Blue (data series), shaded area (confidence interval).
- **Key elements**:
- Vertical dashed line at cycle 5 (Bloom).
- Shaded region around the line (visualizes variability).
### Detailed Analysis
1. **Initial Phase (Cycle 0–5)**:
- Starts at ~1,000 tokens, dropping sharply to ~200 tokens by cycle 5.
- Bloom phase (cycle 5) coincides with the lowest point in this phase.
2. **Mid-Phase (Cycle 5–25)**:
- Fluctuates between ~100–300 tokens.
- Notable peak at ~300 tokens around cycle 15.
3. **Late Phase (Cycle 25–50)**:
- Gradual decline from ~150 tokens (cycle 25) to ~100 tokens (cycle 50).
- Minimal variability compared to earlier cycles.
### Key Observations
- **Sharp Initial Decline**: Cycle lengths drop ~80% from cycle 0 to 5.
- **Bloom Phase**: Cycle 5 marks the lowest point in the first 5 cycles.
- **Peak at Cycle 15**: Unusual resurgence to ~300 tokens, 50% higher than the Bloom phase.
- **Stabilization**: Final 25 cycles show reduced variability (<50 tokens range).
### Interpretation
The data suggests reasoning cycle lengths are highly dynamic in early phases, with the "Bloom" phase (cycle 5) representing a critical transition point. The peak at cycle 15 may indicate task-specific complexity spikes or model adjustments. The gradual decline post-cycle 25 implies stabilization, possibly due to optimized reasoning strategies or reduced problem difficulty. The shaded area highlights inherent variability, suggesting dataset-specific differences (GSM8K, MATH-500, AIME-24) contribute to fluctuations. The Bloom phase’s alignment with the initial drop could reflect a "warm-up" period where shorter cycles suffice for simpler tasks.