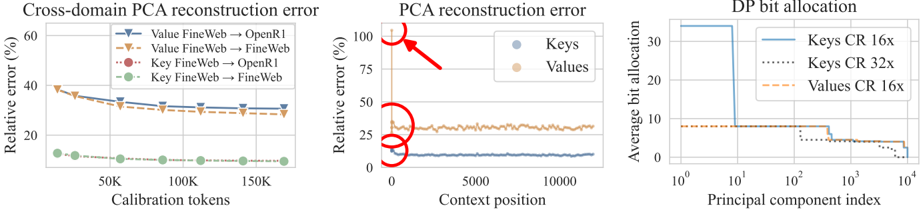
This image contains three distinct charts illustrating performance metrics related to Principal Component Analysis (PCA) reconstruction error and bit allocation for machine learning model components (Keys and Values).
## [Charts]: PCA Reconstruction Error and Bit Allocation
### Overview
The image consists of three side-by-side line charts.
1. **Left:** "Cross-domain PCA reconstruction error" plotted against calibration tokens.
2. **Center:** "PCA reconstruction error" plotted against context position.
3. **Right:** "DP bit allocation" plotted against the principal component index.
---
### Chart 1: Cross-domain PCA reconstruction error
#### Components/Axes
* **X-axis:** "Calibration tokens" (Scale: 0 to 150K).
* **Y-axis:** "Relative error (%)" (Scale: 0 to 60).
* **Legend (Top-Right):**
* Blue inverted triangle: Value FineWeb $\rightarrow$ OpenR1
* Orange inverted triangle: Value FineWeb $\rightarrow$ FineWeb
* Red circle: Key FineWeb $\rightarrow$ OpenR1
* Green circle: Key FineWeb $\rightarrow$ FineWeb
#### Detailed Analysis
* **Trend Verification:**
* **Value series (Blue/Orange):** Both lines start at approximately 40% relative error and show a steady, gradual downward slope as the number of calibration tokens increases, leveling off near 30% at 150K tokens.
* **Key series (Red/Green):** Both lines start at approximately 12% relative error and remain extremely flat and stable across the entire range of calibration tokens.
* **Data Points:**
* Values (Blue/Orange): Start $\approx$ 40%, End $\approx$ 30%.
* Keys (Red/Green): Start $\approx$ 12%, End $\approx$ 10%.
---
### Chart 2: PCA reconstruction error
#### Components/Axes
* **X-axis:** "Context position" (Scale: 0 to 10,000).
* **Y-axis:** "Relative error (%)" (Scale: 0 to 100).
* **Legend (Top-Right):**
* Blue circle: Keys
* Orange circle: Values
* **Annotations:** A red arrow points from the top-right toward the Y-axis at X=0. Red circles highlight the data points at X=0 for both the Keys and Values series.
#### Detailed Analysis
* **Trend Verification:**
* **Values (Orange):** The line begins at a very high error rate (>100% at X=0), drops sharply within the first few hundred context positions, and then stabilizes at a constant error rate of approximately 30%.
* **Keys (Blue):** The line begins at a lower error rate ($\approx$ 20% at X=0), drops slightly, and then stabilizes at a constant error rate of approximately 10%.
* **Key Observations:** The red arrow and circles emphasize the significant spike in reconstruction error at the very beginning of the context window (position 0), particularly for the "Values" component.
---
### Chart 3: DP bit allocation
#### Components/Axes
* **X-axis:** "Principal component index" (Logarithmic scale: $10^0$ to $10^4$).
* **Y-axis:** "Average bit allocation" (Scale: 0 to 30).
* **Legend (Top-Right):**
* Blue solid line: Keys CR 16x
* Black dotted line: Keys CR 32x
* Orange dashed line: Values CR 16x
#### Detailed Analysis
* **Trend Verification:**
* **Keys CR 16x (Blue):** Starts at a high allocation ($\approx$ 35 bits) for the first 10 components, then drops sharply to $\approx$ 8 bits, and eventually steps down to $\approx$ 4 bits as the index increases.
* **Values CR 16x (Orange):** Starts at $\approx$ 8 bits and remains relatively flat until index $\approx$ 1000, where it steps down.
* **Keys CR 32x (Black dotted):** Starts at $\approx$ 8 bits, drops to $\approx$ 5 bits at index $\approx$ 100, and drops to near 0 bits after index 1000.
* **Key Observations:** The "Keys" at 16x compression require significantly higher bit allocation for the initial principal components compared to the "Values" or the higher compression "Keys" (32x).
---
### Interpretation
The data suggests a fundamental difference in how "Keys" and "Values" in the transformer architecture are represented and compressed via PCA:
1. **Reconstruction Difficulty:** "Values" are consistently harder to reconstruct than "Keys," evidenced by the higher relative error in both the cross-domain and context-position charts.
2. **Context Sensitivity:** The spike in error at the start of the context window (Chart 2) suggests that the initial tokens (likely special tokens or positional embeddings) have distinct, high-variance representations that are difficult to compress using standard PCA trained on the rest of the sequence.
3. **Compression Efficiency:** Chart 3 demonstrates that "Keys" (at 16x) are "front-loaded" in terms of information density—they require a high bit allocation for the first few principal components. Conversely, "Values" are more uniformly distributed, requiring fewer bits for the initial components but maintaining that allocation longer. The "Keys CR 32x" line shows that increasing the compression ratio forces the model to discard information from higher-index components much more aggressively.