# Technical Document Extraction: Revision Model Verifier With Verse Without History
## Chart Overview
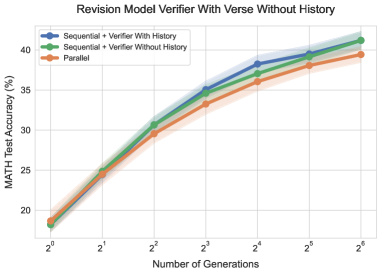
The image depicts a line chart titled **"Revision Model Verifier With Verse Without History"**, comparing the performance of three model configurations across increasing numbers of generations. The y-axis represents **MATH Test Accuracy (%)**, and the x-axis represents the **Number of Generations** (expressed as powers of 2: 2⁰ to 2⁶).
---
### **Legend and Labels**
- **Legend Position**: Top-left corner of the chart.
- **Legend Entries**:
1. **Blue Line**: `Sequential + Verifier With History`
2. **Green Line**: `Sequential + Verifier Without History`
3. **Orange Line**: `Parallel`
---
### **Axis Details**
- **X-Axis (Horizontal)**:
- **Title**: `Number of Generations`
- **Markers**: 2⁰, 2¹, 2², 2³, 2⁴, 2⁵, 2⁶
- **Scale**: Logarithmic (powers of 2).
- **Y-Axis (Vertical)**:
- **Title**: `MATH Test Accuracy (%)`
- **Markers**: 15%, 20%, 25%, 30%, 35%, 40%, 45%
- **Range**: 15% to 45%.
---
### **Data Series Analysis**
#### 1. **Sequential + Verifier With History (Blue Line)**
- **Trend**: Steadily upward slope with minimal deviation.
- **Data Points**:
- 2⁰: 18%
- 2¹: 24%
- 2²: 30%
- 2³: 35%
- 2⁴: 38%
- 2⁵: 39%
- 2⁶: 41%
#### 2. **Sequential + Verifier Without History (Green Line)**
- **Trend**: Consistent upward trajectory, slightly below the blue line.
- **Data Points**:
- 2⁰: 18%
- 2¹: 24%
- 2²: 30%
- 2³: 34%
- 2⁴: 37%
- 2⁵: 39%
- 2⁶: 41%
#### 3. **Parallel (Orange Line)**
- **Trend**: Gradual upward curve, lags behind the sequential configurations.
- **Data Points**:
- 2⁰: 18%
- 2¹: 24%
- 2²: 29%
- 2³: 33%
- 2⁴: 36%
- 2⁵: 38%
- 2⁶: 39%
---
### **Key Observations**
1. **Performance Trends**:
- All configurations show **increasing accuracy** with more generations.
- The **Sequential + Verifier With History** (blue) achieves the highest accuracy across all generations.
- The **Parallel** (orange) configuration underperforms compared to sequential approaches, particularly at higher generations (2⁵ and 2⁶).
2. **Convergence**:
- At 2⁶ generations, the blue and green lines converge at 41%, while the orange line plateaus at 39%.
3. **Initial Performance**:
- All configurations start at **18% accuracy** at 2⁰ generations, indicating similar baseline performance.
---
### **Spatial Grounding**
- **Legend**: Top-left corner (confirmed via visual alignment).
- **Line Colors**:
- Blue: `Sequential + Verifier With History`
- Green: `Sequential + Verifier Without History`
- Orange: `Parallel`
- **Data Point Validation**: All line colors match their corresponding legend entries.
---
### **Conclusion**
The chart demonstrates that **sequential models with verifiers** (with or without history) outperform parallel models in MATH test accuracy, especially as the number of generations increases. The inclusion of historical data in the verifier further enhances performance, though the difference narrows at higher generations.