## Line Chart: Test Loss vs. Gradient Updates for Different 'd' Values
### Overview
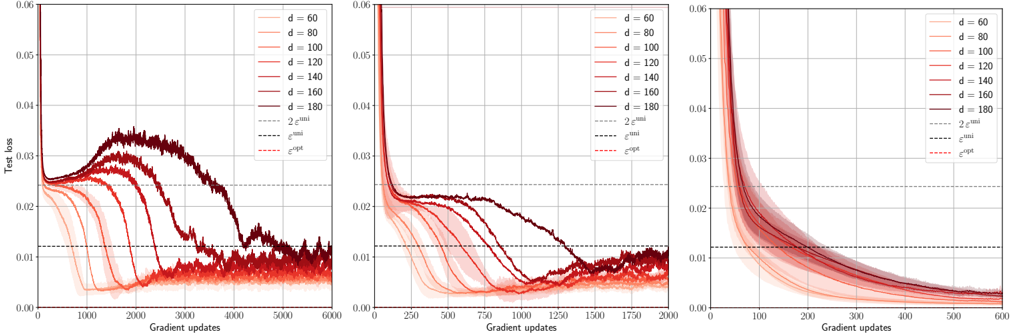
The image presents three line charts displaying the relationship between "Test loss" and "Gradient updates" for various values of 'd'. Each chart appears to represent a different range of gradient updates, with 'd' values ranging from 60 to 180. The charts also include lines representing different optimization algorithms: `2^mil`, `mil`, and `exp`.
### Components/Axes
* **X-axis:** "Gradient updates" - Ranges from 0 to 6000 in the first chart, 0 to 2000 in the second, and 0 to 600 in the third.
* **Y-axis:** "Test loss" - Ranges from 0 to 0.06 in all three charts.
* **Legend:** Located in the top-right corner of each chart, listing the following:
* `d = 60` (Lightest Red)
* `d = 80` (Slightly Darker Red)
* `d = 100` (Medium Red)
* `d = 120` (Darker Red)
* `d = 140` (Even Darker Red)
* `d = 160` (Darkest Red)
* `d = 180` (Very Dark Red)
* `2^mil` (Dotted Black Line)
* `mil` (Dashed Black Line)
* `exp` (Dashed Red Line)
### Detailed Analysis or Content Details
**Chart 1 (Gradient Updates 0-6000):**
* **d = 60:** Starts at approximately 0.055, initially increases slightly, then decreases rapidly to around 0.005 by gradient update 2000, and plateaus around 0.003.
* **d = 80:** Starts at approximately 0.05, decreases rapidly to around 0.006 by gradient update 2000, and plateaus around 0.004.
* **d = 100:** Starts at approximately 0.048, decreases rapidly to around 0.007 by gradient update 2000, and plateaus around 0.005.
* **d = 120:** Starts at approximately 0.045, decreases rapidly to around 0.008 by gradient update 2000, and plateaus around 0.006.
* **d = 140:** Starts at approximately 0.042, decreases rapidly to around 0.009 by gradient update 2000, and plateaus around 0.007.
* **d = 160:** Starts at approximately 0.04, decreases rapidly to around 0.01 by gradient update 2000, and plateaus around 0.008.
* **d = 180:** Starts at approximately 0.038, decreases rapidly to around 0.011 by gradient update 2000, and plateaus around 0.009.
* **2^mil:** Starts at approximately 0.05, decreases slowly to around 0.015 by gradient update 6000.
* **mil:** Starts at approximately 0.05, decreases slowly to around 0.016 by gradient update 6000.
* **exp:** Starts at approximately 0.05, decreases rapidly to around 0.008 by gradient update 1000, then plateaus around 0.007.
**Chart 2 (Gradient Updates 0-2000):**
* The trends for each 'd' value are similar to Chart 1, but the curves are truncated at 2000 gradient updates. The initial decrease is more pronounced.
**Chart 3 (Gradient Updates 0-600):**
* The trends for each 'd' value are similar to Chart 1 and 2, but the curves are truncated at 600 gradient updates. The initial decrease is even more pronounced.
### Key Observations
* As 'd' increases, the initial test loss value generally decreases.
* For all 'd' values, the test loss decreases rapidly with increasing gradient updates, then plateaus.
* The `exp` algorithm consistently achieves the lowest test loss compared to `2^mil` and `mil`.
* The `2^mil` and `mil` algorithms show similar performance.
* The rate of decrease in test loss appears to slow down as 'd' increases.
### Interpretation
These charts demonstrate the impact of the 'd' parameter and different optimization algorithms on the test loss during training. The 'd' parameter likely represents a learning rate or a related hyperparameter. The results suggest that increasing 'd' (up to a certain point) can lead to faster convergence and lower test loss. The `exp` algorithm appears to be the most effective at minimizing test loss, potentially due to its adaptive learning rate. The plateaus observed in each curve indicate that the model has likely converged, and further gradient updates yield diminishing returns. The three charts provide a view of the convergence process at different time scales, allowing for a more comprehensive understanding of the training dynamics. The consistent trends across the three charts suggest that the observed relationships are robust and not simply artifacts of the specific range of gradient updates examined.