## Line Chart: Test Loss vs. Gradient Updates Across Dimensions
### Overview
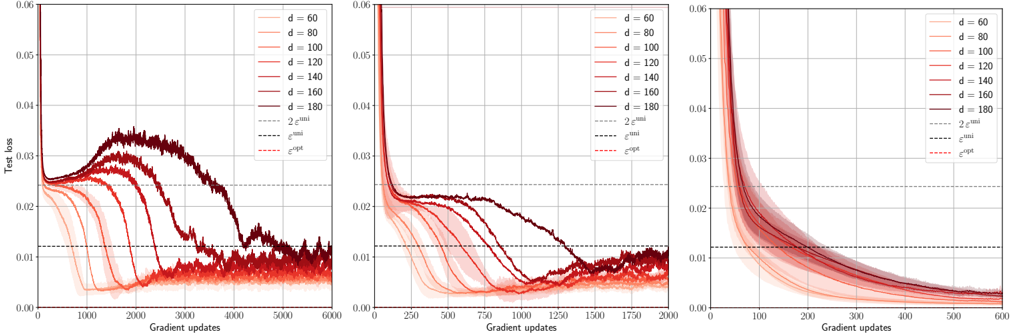
The image displays three subplots showing the convergence of test loss over gradient updates for neural network training across different input dimensions (d=60, 80, 100, 120, 140, 160, 180). Each subplot represents a different range of gradient updates (0-6000, 0-1750, 0-600), with shaded regions indicating confidence intervals and dashed lines representing theoretical bounds (2e^uni and e^opt).
### Components/Axes
- **X-axis**: Gradient updates (0 to 6000 in first subplot, 0-1750 in second, 0-600 in third)
- **Y-axis**: Test loss (0.00 to 0.06)
- **Legend**:
- Solid lines: Input dimensions (d=60 to d=180 in 20 increments)
- Dashed lines:
- Gray: 2e^uni (theoretical upper bound)
- Black: e^opt (optimal convergence rate)
- **Shading**: Confidence intervals around each data series
### Detailed Analysis
1. **First Subplot (0-6000 updates)**:
- Lines for d=60 (lightest red) to d=180 (darkest red) show decreasing test loss with gradient updates.
- Initial spike in test loss for all d values, followed by rapid decline.
- Shaded regions widen for smaller d values, indicating higher uncertainty.
- All lines converge toward the 2e^uni bound (gray dashed line) by ~3000 updates.
2. **Second Subplot (0-1750 updates)**:
- Similar trend to first subplot but with shorter x-axis range.
- d=180 (darkest red) achieves lowest test loss (~0.01) by 1750 updates.
- Shaded regions for d=60-100 remain above 0.02 throughout.
3. **Third Subplot (0-600 updates)**:
- Steepest decline observed for all d values.
- d=180 reaches ~0.015 test loss by 600 updates.
- Confidence intervals narrow significantly compared to first subplot.
### Key Observations
- **Dimension-Dependent Convergence**: Higher d values (160-180) achieve lower test loss faster than smaller d values.
- **Theoretical Bounds**: Actual performance approaches but does not cross the 2e^uni bound in all subplots.
- **Confidence Intervals**: Uncertainty decreases with more updates and larger d values.
- **Initial Instability**: All d values show similar initial test loss spikes (~0.05-0.06) before rapid improvement.
### Interpretation
The data demonstrates that increasing input dimension (d) improves optimization efficiency, with larger networks converging to lower test loss more rapidly. The shaded regions quantify uncertainty, showing that smaller networks (d=60-100) have less predictable convergence paths. The theoretical bounds (2e^uni and e^opt) suggest diminishing returns in optimization gains beyond certain update thresholds. Notably, the third subplot's steeper decline implies that early updates are critical for establishing convergence trajectories, with later updates providing incremental improvements. This pattern aligns with the "double descent" phenomenon in high-dimensional learning, where model complexity initially harms performance before becoming beneficial.