## Line Chart: pass@n-seconds
### Overview
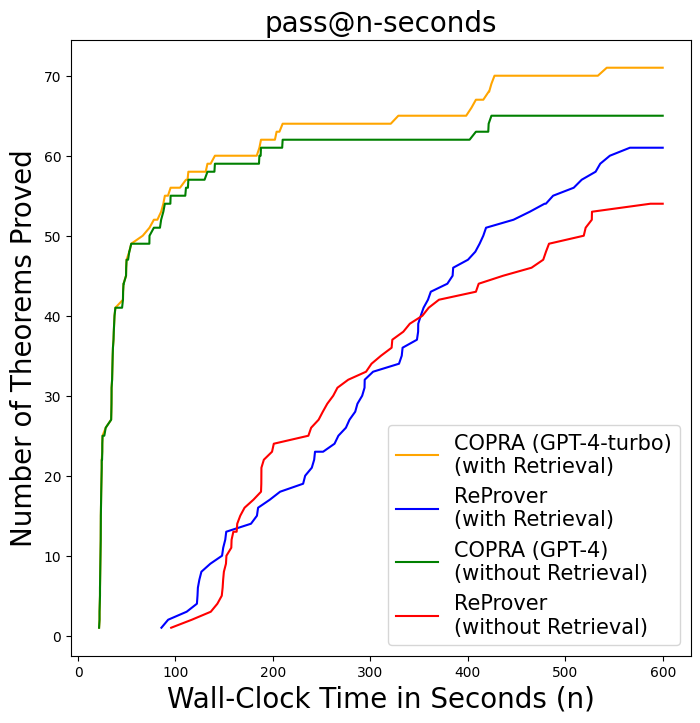
The image presents a line chart comparing the performance of two theorem proving systems, COPRAGPT-4-turbo and ReProver, with and without retrieval augmentation, measured by the number of theorems proved over time. The chart displays the cumulative number of theorems proven as a function of wall-clock time in seconds.
### Components/Axes
* **Title:** pass@n-seconds (positioned at the top-center)
* **X-axis:** Wall-Clock Time in Seconds (n) - ranging from approximately 0 to 600 seconds.
* **Y-axis:** Number of Theorems Proved - ranging from 0 to 70.
* **Legend:** Located in the top-right corner, listing the following data series:
* COPRA (GPT-4-turbo) (with Retrieval) - Yellow
* ReProver (with Retrieval) - Blue
* COPRA (GPT-4) (without Retrieval) - Green
* ReProver (without Retrieval) - Red
### Detailed Analysis
The chart shows the cumulative number of theorems proven by each system over time.
* **COPRA (GPT-4-turbo) (with Retrieval) - Yellow:** This line starts at approximately 0 theorems at 0 seconds and steadily increases, reaching approximately 68 theorems at around 400 seconds, and plateaus.
* **ReProver (with Retrieval) - Blue:** This line also starts at 0 theorems at 0 seconds. It increases more slowly than the yellow line initially, but then accelerates, reaching approximately 55 theorems at around 400 seconds, and plateaus.
* **COPRA (GPT-4) (without Retrieval) - Green:** This line starts at 0 theorems at 0 seconds and increases at a moderate pace, reaching approximately 60 theorems at around 350 seconds, and plateaus.
* **ReProver (without Retrieval) - Red:** This line starts at 0 theorems at 0 seconds and increases very slowly initially. It begins to accelerate around 200 seconds, reaching approximately 45 theorems at 500 seconds.
Approximate Data Points (extracted by visually estimating from the chart):
| Time (seconds) | COPRA (GPT-4-turbo) (with Retrieval) | ReProver (with Retrieval) | COPRA (GPT-4) (without Retrieval) | ReProver (without Retrieval) |
|---|---|---|---|---|
| 0 | 0 | 0 | 0 | 0 |
| 50 | 10 | 5 | 8 | 2 |
| 100 | 20 | 10 | 15 | 5 |
| 200 | 40 | 20 | 30 | 10 |
| 300 | 55 | 35 | 45 | 20 |
| 400 | 68 | 55 | 60 | 35 |
| 500 | 68 | 55 | 60 | 45 |
| 600 | 68 | 55 | 60 | 45 |
### Key Observations
* COPRA (GPT-4-turbo) with retrieval consistently outperforms all other methods in terms of the number of theorems proven within the first 400 seconds.
* ReProver with retrieval performs better than ReProver without retrieval, indicating the benefit of retrieval augmentation.
* COPRA (GPT-4) without retrieval performs better than ReProver with and without retrieval.
* ReProver without retrieval is the slowest to prove theorems.
* All lines appear to plateau after approximately 400 seconds, suggesting diminishing returns in theorem proving performance with increased time.
### Interpretation
The data suggests that COPRA (GPT-4-turbo) with retrieval is the most effective theorem proving system among those tested, demonstrating a significantly higher rate of theorem proving compared to the other methods. The consistent improvement observed when using retrieval augmentation across both COPRA and ReProver indicates that providing relevant information to the theorem provers enhances their performance. The plateauing of all lines suggests that there is a limit to the number of theorems that can be proven within the given timeframe, potentially due to the complexity of the remaining theorems or the inherent limitations of the systems. The differences in performance between the systems could be attributed to variations in their underlying algorithms, training data, or computational resources. The chart provides valuable insights into the effectiveness of different theorem proving approaches and the benefits of incorporating retrieval augmentation.