# Technical Document Extraction: OpenWeb Data Analysis
## 1. Image Overview
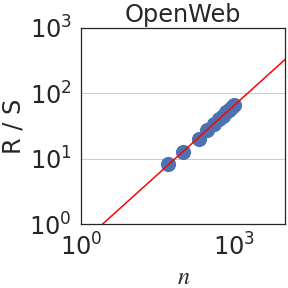
This image is a log-log scatter plot with a linear regression line, representing data for "OpenWeb". It illustrates the relationship between a variable $n$ and a ratio $R/S$.
## 2. Component Isolation
### Header
- **Title:** OpenWeb (Centered at the top of the chart area).
### Main Chart Area
- **Type:** Log-Log Plot (both axes use logarithmic scales).
- **Data Series 1 (Scatter):** Large blue circular markers.
- **Data Series 2 (Trendline):** A solid red line passing through the data points.
- **Gridlines:** Horizontal grey lines are visible at the major tick marks of the Y-axis ($10^1$ and $10^2$).
### Axis Labels and Markers
- **X-axis (Horizontal):**
- **Label:** $n$ (italicized).
- **Markers:** $10^0$ (at the origin), $10^3$ (towards the right).
- **Y-axis (Vertical):**
- **Label:** $R/S$.
- **Markers:** $10^0$ (at the origin), $10^1$, $10^2$, $10^3$ (top).
## 3. Trend Verification and Data Extraction
### Trend Analysis
- **Visual Trend:** The blue data points follow a strictly positive, linear path on the log-log scale. This indicates a power-law relationship between $n$ and $R/S$.
- **Red Line:** The red line slopes upward from the bottom-left toward the top-right, acting as a line of best fit for the blue markers.
### Data Point Estimation (Spatial Grounding)
Given the logarithmic scale, the following approximations can be made based on the visual placement of the blue markers:
| Data Point (Approx.) | $n$ (X-axis) | $R/S$ (Y-axis) |
| :--- | :--- | :--- |
| First Marker | $\approx 2 \times 10^2$ | $\approx 8 \times 10^0$ |
| Second Marker | $\approx 3 \times 10^2$ | $\approx 1.2 \times 10^1$ |
| Cluster Start | $\approx 5 \times 10^2$ | $\approx 2 \times 10^1$ |
| Cluster End | $\approx 10^3$ | $\approx 7 \times 10^1$ |
The data points are concentrated between $n = 10^2$ and $n = 10^3$.
## 4. Mathematical Interpretation
The plot suggests a relationship of the form:
$$\log(R/S) = m \cdot \log(n) + c$$
Or, in power-law form:
$$R/S \propto n^k$$
The slope ($m$) appears to be slightly less than 1, as the line rises approximately two orders of magnitude on the Y-axis ($10^0$ to $10^2$) over a slightly larger span on the X-axis.
## 5. Textual Transcription
- **Top Title:** OpenWeb
- **Y-axis Label:** R / S
- **X-axis Label:** n
- **Y-axis Ticks:** $10^0$, $10^1$, $10^2$, $10^3$
- **X-axis Ticks:** $10^0$, $10^3$