## Diagram: 3D HBM and TPU/GPU System Architecture
### Overview
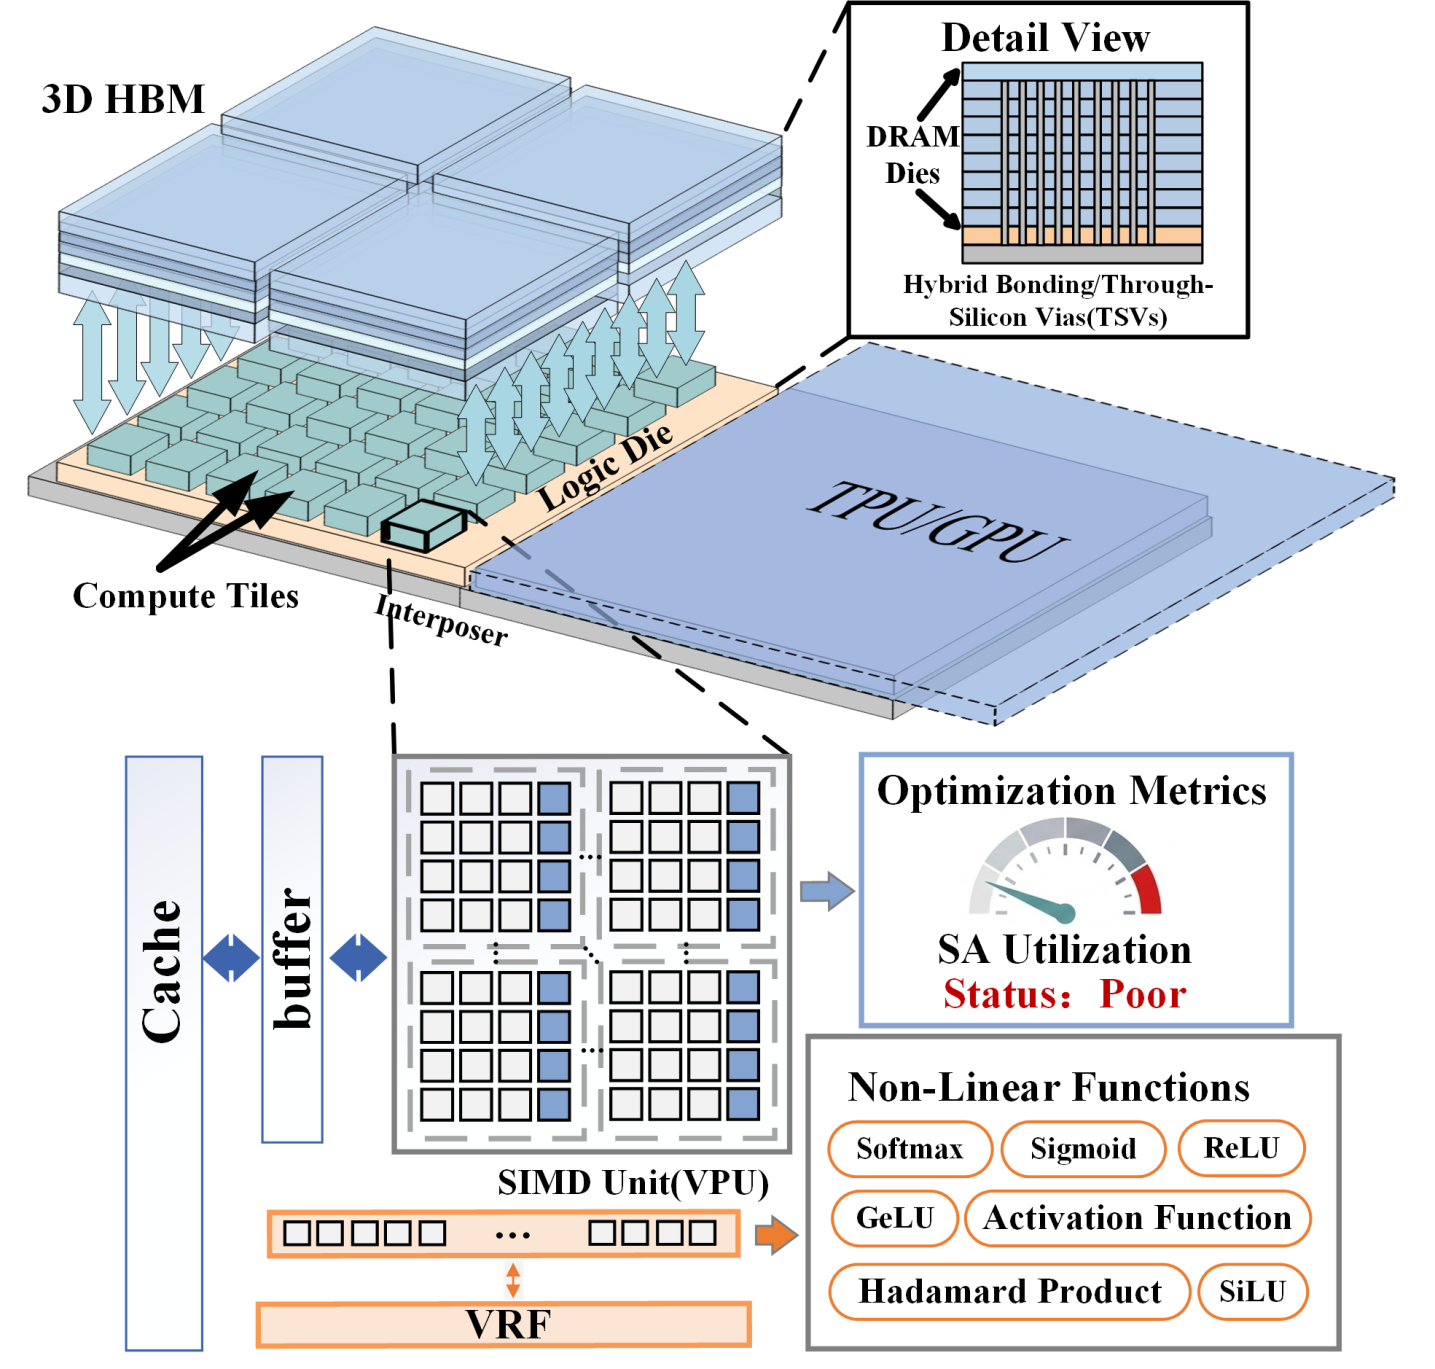
The diagram illustrates a complex 3D heterogeneous computing system integrating 3D High Bandwidth Memory (HBM), TPU/GPU, compute tiles, logic dies, and interposers. It includes detailed views of memory hierarchy (cache, buffer), processing units (SIMD Unit/VPU), and optimization metrics. The system emphasizes hybrid bonding/through-silicon vias (TSVs) for interconnectivity.
### Components/Axes
1. **3D HBM**:
- Labeled as "3D HBM" with stacked layers.
- Arrows indicate data flow (downward from HBM to lower layers).
- Detail view shows "DRAM Dies" with "Hybrid Bonding/Through-Silicon Vias (TSVs)."
2. **TPU/GPU**:
- Labeled "TPU/GPU" as a large blue block.
- Connected to the interposer via dashed lines.
3. **Compute Tiles**:
- Labeled "Compute Tiles" with green blocks.
- Arrows point to "Logic Die" (smaller green block).
4. **Interposer**:
- Central orange block labeled "Interposer."
- Connects "Logic Die" to "TPU/GPU."
5. **SIMD Unit (VPU)**:
- Grid of white/blue squares labeled "SIMD Unit (VPU)."
- Connected to "Cache" (vertical blue bar) and "Buffer" (vertical blue bar).
6. **VRF**:
- Horizontal orange block labeled "VRF" below the SIMD Unit.
7. **Optimization Metrics**:
- Gauge labeled "SA Utilization Status: Poor" (red needle).
- List of "Non-Linear Functions": Softmax, Sigmoid, ReLU, GeLU, Activation Function, Hadamard Product, SiLU.
### Detailed Analysis
- **3D HBM**:
- Multiple layers (4–5) with data flowing downward via TSVs.
- Detail view confirms TSVs as vertical interconnects between DRAM dies.
- **TPU/GPU**:
- Positioned as the primary processing unit, connected to the interposer.
- **Compute Tiles & Logic Die**:
- Compute Tiles (green) and Logic Die (smaller green) are part of the lower layer, feeding data to the interposer.
- **SIMD Unit (VPU)**:
- Grid structure suggests parallel processing units.
- Connected to cache and buffer for data storage/retrieval.
- **VRF**:
- Positioned below the SIMD Unit, possibly for voltage/frequency control.
- **Optimization Metrics**:
- Gauge indicates "Poor" utilization, suggesting inefficiency in system performance.
- Non-linear functions are standard in neural networks, implying the system is optimized for AI/ML workloads.
### Key Observations
- **Data Flow**: Data moves from 3D HBM through the interposer to the TPU/GPU, with intermediate processing in compute tiles and logic dies.
- **Poor Utilization**: The "Poor" SA utilization metric highlights potential bottlenecks or underutilization of resources.
- **Non-Linear Functions**: The presence of activation functions (e.g., ReLU, GeLU) confirms the system’s use in deep learning.
### Interpretation
The diagram represents a high-performance computing architecture optimized for AI/ML tasks. The 3D HBM provides high-bandwidth memory access, while the TPU/GPU handles parallel computations. The interposer and TSVs enable efficient interconnectivity between layers. However, the "Poor" SA utilization suggests inefficiencies, possibly due to suboptimal workload distribution or hardware limitations. The inclusion of non-linear functions underscores the system’s focus on neural network acceleration. The VRF and cache/buffer components indicate a focus on power management and data throughput optimization. Overall, the architecture balances memory, processing, and optimization, but the poor utilization metric warrants further investigation into system design or workload management.