## Histogram: Question and Answer Token Distribution
### Overview
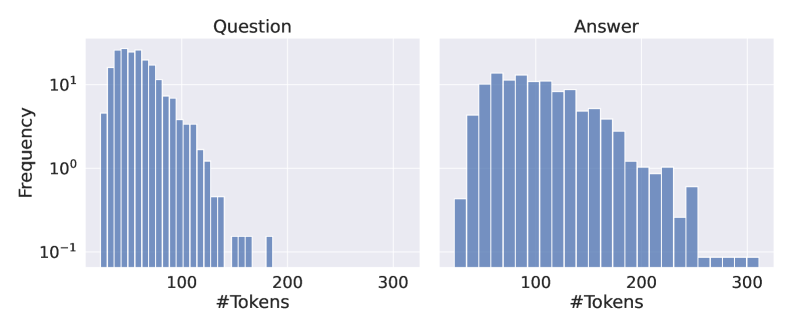
The image presents two histograms side-by-side, displaying the frequency distribution of the number of tokens for "Question" and "Answer" texts. The y-axis (Frequency) is on a logarithmic scale. The x-axis represents the number of tokens.
### Components/Axes
* **Titles:**
* Left Histogram: "Question"
* Right Histogram: "Answer"
* **X-axis:**
* Label: "#Tokens"
* Scale: 0 to 300, with implicit increments of 20 tokens per bar.
* **Y-axis:**
* Label: "Frequency"
* Scale: Logarithmic, ranging from 10<sup>-1</sup> to 10<sup>1</sup> (0.1 to 10).
* **Bars:** The histograms are composed of vertical bars, where the height of each bar represents the frequency of a specific token count range.
### Detailed Analysis
**Left Histogram (Question):**
* **Trend:** The frequency decreases as the number of tokens increases.
* **Peak:** The highest frequency occurs around 50 tokens.
* **Values:**
* 50 tokens: Frequency is approximately 10.
* 100 tokens: Frequency is approximately 3.
* 150 tokens: Frequency is approximately 0.5.
* 200 tokens: Frequency is approximately 0.15.
* 250 tokens: Frequency is approximately 0.1.
* 300 tokens: Frequency is approximately 0.
**Right Histogram (Answer):**
* **Trend:** The frequency initially increases, peaks, and then decreases as the number of tokens increases.
* **Peak:** The highest frequency occurs around 100 tokens.
* **Values:**
* 50 tokens: Frequency is approximately 3.
* 100 tokens: Frequency is approximately 8.
* 150 tokens: Frequency is approximately 6.
* 200 tokens: Frequency is approximately 3.
* 250 tokens: Frequency is approximately 0.3.
* 300 tokens: Frequency is approximately 0.1.
### Key Observations
* The distribution of tokens in "Questions" is skewed towards lower token counts compared to "Answers."
* "Answers" have a more bell-shaped distribution, with a clear peak around 100 tokens.
* Both distributions show a long tail, indicating that while most questions and answers have relatively few tokens, some have significantly more.
### Interpretation
The histograms suggest that, on average, "Answers" tend to have a higher number of tokens than "Questions." The skewed distribution of "Questions" indicates that shorter questions are more common. The bell-shaped distribution of "Answers" suggests a typical length for answers, with deviations being less frequent. This could be due to the nature of the questions requiring a certain level of detail in the answers. The long tails in both distributions indicate the presence of outliers, i.e., very long questions and answers, which could be due to complex or detailed topics.