## Bar Charts: Question and Answer Token Frequency Distribution
### Overview
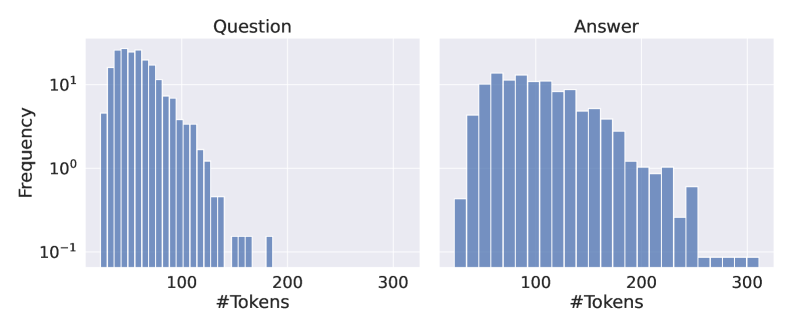
The image contains two side-by-side bar charts comparing the frequency distribution of token counts for "Questions" (left) and "Answers" (right). Both charts use a logarithmic y-axis scale (10⁻¹ to 10¹) and a linear x-axis scale (#Tokens: 0–300). The charts reveal distinct patterns in token length distributions between questions and answers.
### Components/Axes
- **X-axis (Horizontal)**:
- Label: "#Tokens"
- Scale: Linear, 0–300 tokens
- Tick marks: Every 50 tokens (0, 50, 100, 150, 200, 250, 300)
- **Y-axis (Vertical)**:
- Label: "Frequency"
- Scale: Logarithmic (10⁻¹ to 10¹)
- Tick marks: 10⁻¹, 10⁰, 10¹
- **Legend**:
- No explicit legend present, but bar colors differentiate categories:
- **Blue bars**: Represent both "Question" and "Answer" distributions
- **Chart Titles**:
- Left chart: "Question"
- Right chart: "Answer"
### Detailed Analysis
#### Question Chart (Left)
- **Trend**:
- Highest frequency (10¹) occurs at ~50 tokens
- Sharp decline to 10⁰ frequency at ~100 tokens
- Minimal activity beyond 150 tokens (frequency < 10⁻¹)
- **Key Data Points**:
- 50 tokens: ~10 occurrences
- 100 tokens: ~1 occurrence
- 150 tokens: ~0.1 occurrences
#### Answer Chart (Right)
- **Trend**:
- Peak frequency (10¹) occurs at ~150 tokens
- Gradual decline to 10⁰ frequency at ~250 tokens
- Slight uptick at ~250 tokens (~0.5 occurrences)
- **Key Data Points**:
- 150 tokens: ~10 occurrences
- 200 tokens: ~5 occurrences
- 250 tokens: ~0.5 occurrences
### Key Observations
1. **Length Distribution**:
- Questions cluster tightly around shorter token counts (peak at 50 tokens)
- Answers exhibit longer token lengths with a broader distribution (peak at 150 tokens)
2. **Frequency Magnitude**:
- Questions show 100x higher peak frequency than answers at their respective maxima
- Answers maintain higher frequencies across longer token ranges (100–250 tokens)
3. **Logarithmic Scale Impact**:
- Visual compression of high-frequency ranges (10⁰–10¹) makes differences in lower frequencies (10⁻¹) appear exaggerated
### Interpretation
The data suggests a fundamental asymmetry in question-answer dynamics:
- **Questions**:
- Typically concise, with most requiring <100 tokens
- High frequency of short questions implies a focus on direct, factual inquiries
- **Answers**:
- Require significantly more tokens (median ~150 tokens)
- Gradual decline in frequency suggests increasing complexity or variability in longer responses
- **Practical Implications**:
- System design for QA processing should allocate more computational resources to answer generation
- Token budgeting for responses should prioritize 100–200 token ranges
- The logarithmic scale highlights that even small frequency differences at high token counts represent substantial absolute quantities
### Anomalies
- **Question Chart**:
- Unexplained gap between 100–150 tokens (frequency drops from 10⁰ to 10⁻¹)
- Possible indication of data preprocessing or filtering at this range
- **Answer Chart**:
- Slight uptick at 250 tokens may indicate outliers or specialized response types