## Vector and Relation Diagram
### Overview
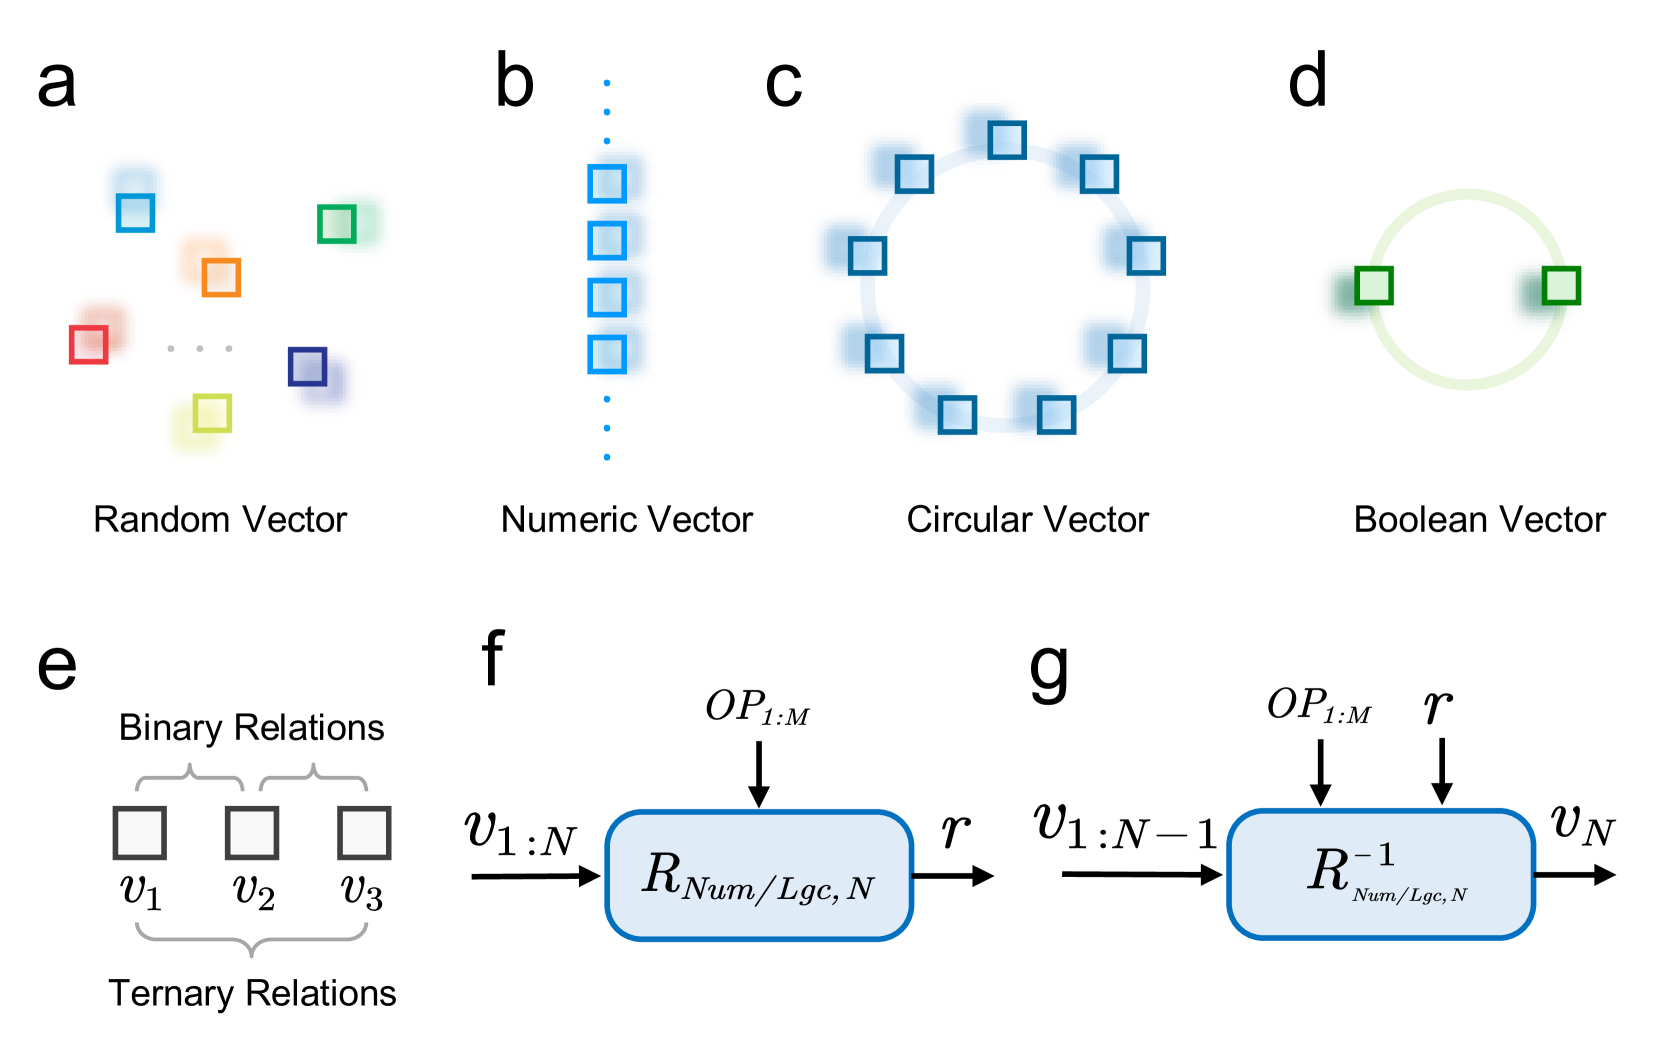
The image presents a series of diagrams illustrating different types of vectors and relations. It includes examples of random, numeric, circular, and boolean vectors, as well as binary and ternary relations. The image also depicts a process involving transformations denoted by R and R⁻¹.
### Components/Axes
* **Diagram a:** Labeled "Random Vector". It shows several squares of different colors (red, orange, yellow, green, blue) scattered randomly.
* **Diagram b:** Labeled "Numeric Vector". It shows a vertical column of blue squares, with dotted lines extending above and below the squares.
* **Diagram c:** Labeled "Circular Vector". It shows a ring of blue squares.
* **Diagram d:** Labeled "Boolean Vector". It shows two green squares positioned on opposite sides of a green circle.
* **Diagram e:** Labeled "Binary Relations" and "Ternary Relations". It shows three squares labeled v1, v2, and v3. A bracket above v1 and v2, and v2 and v3 indicates binary relations. A bracket below v1, v2, and v3 indicates ternary relations.
* **Diagram f:** Shows a process with an input v1:N, an operation OP1:M, and a transformation RNum/Lgc, N, resulting in an output r.
* **Diagram g:** Shows a process with inputs v1:N-1, r, an operation OP1:M, and a transformation R⁻¹Num/Lgc, N, resulting in an output vN.
### Detailed Analysis or Content Details
* **Random Vector (a):** The squares are positioned seemingly at random. The colors are approximately red, orange, yellow, green, and blue.
* **Numeric Vector (b):** The blue squares are aligned vertically. The dotted lines suggest an infinite or continuous sequence.
* **Circular Vector (c):** The blue squares are evenly spaced around the circumference of an implied circle.
* **Boolean Vector (d):** The green squares are diametrically opposed on the green circle.
* **Binary/Ternary Relations (e):** The diagram illustrates the concept of relations between elements. Binary relations connect two elements, while ternary relations connect three.
* **Process f:**
* Input: v1:N
* Operation: OP1:M (arrow pointing down)
* Transformation: RNum/Lgc, N (blue rounded rectangle)
* Output: r
* **Process g:**
* Inputs: v1:N-1, r
* Operation: OP1:M (arrow pointing down)
* Transformation: R⁻¹Num/Lgc, N (blue rounded rectangle)
* Output: vN
### Key Observations
* The diagrams use simple geometric shapes (squares, circles) to represent vectors and relations.
* The color coding (different colors for random vectors, blue for numeric/circular, green for boolean) may indicate different data types or properties.
* The processes in diagrams f and g suggest a transformation and its inverse.
### Interpretation
The image provides a visual representation of different types of vectors and relations, likely within a mathematical or computational context. The random vector illustrates unordered data, while the numeric and circular vectors suggest ordered or structured data. The boolean vector represents binary data. The diagrams involving R and R⁻¹ likely represent a transformation and its inverse, suggesting a reversible process. The OP1:M notation likely represents an operation applied during the transformation. The subscripts "Num/Lgc" on R and R⁻¹ suggest that the transformation involves both numerical and logical operations. The overall image seems to be illustrating fundamental concepts in data representation and manipulation.