## Bar Chart: Overall Accuracy Comparison of Algorithms
### Overview
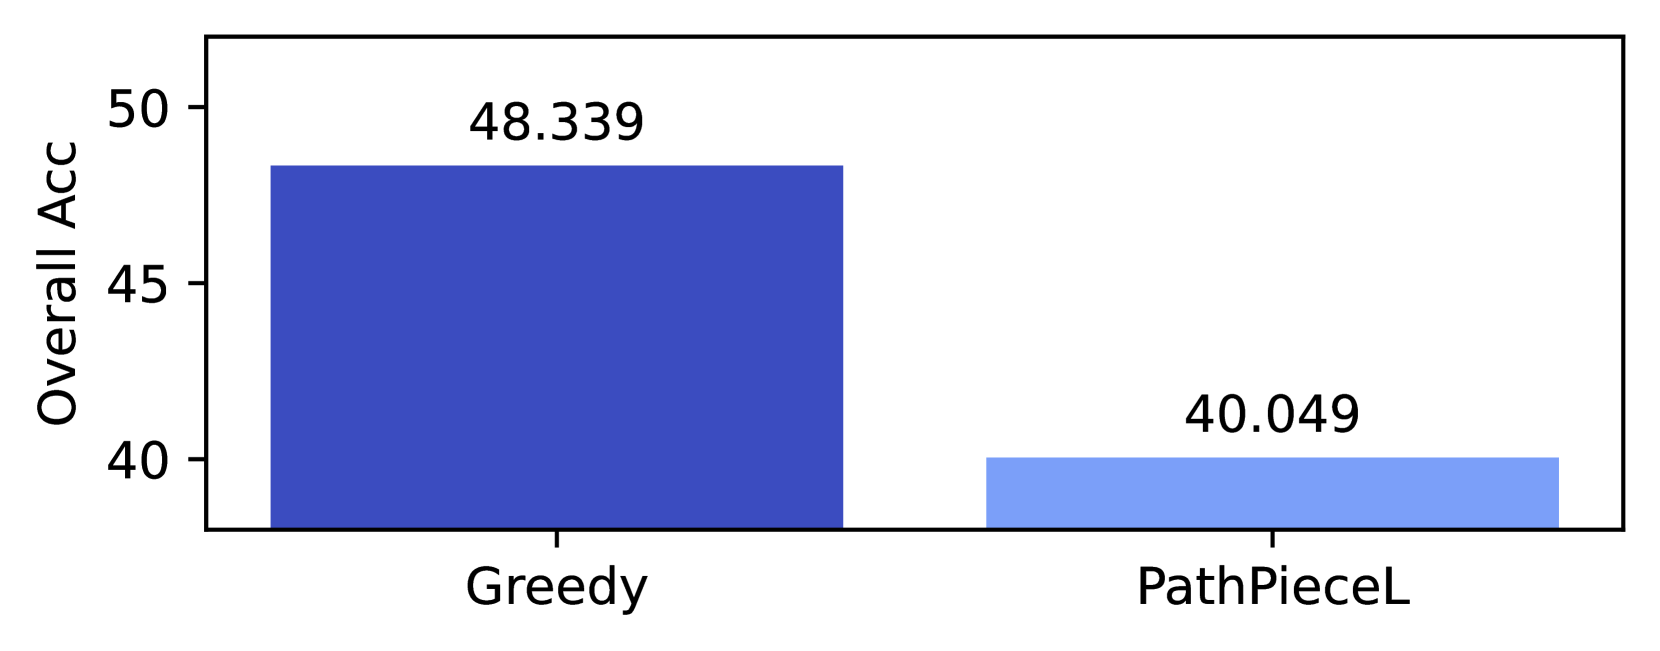
The image is a bar chart comparing the **Overall Accuracy** of two algorithms: **Greedy** and **PathPieceL**. The chart uses vertical bars to represent accuracy percentages, with distinct colors for each algorithm.
### Components/Axes
- **Y-Axis**: Labeled **"Overall Acc"** (Overall Accuracy), scaled from 40 to 50 in increments of 5.
- **X-Axis**: Categorizes the algorithms as **"Greedy"** and **"PathPieceL"**.
- **Bars**:
- **Greedy**: Dark blue bar with a value of **48.339**.
- **PathPieceL**: Light blue bar with a value of **40.049**.
- **Legend**: No explicit legend is present, but colors differentiate the algorithms (dark blue = Greedy, light blue = PathPieceL).
### Detailed Analysis
- **Greedy**:
- Positioned on the left.
- Bar height reaches **48.339** on the Y-axis.
- Value labeled in black text above the bar.
- **PathPieceL**:
- Positioned on the right.
- Bar height reaches **40.049** on the Y-axis.
- Value labeled in black text above the bar.
### Key Observations
1. **Greedy** significantly outperforms **PathPieceL** in Overall Accuracy, with a difference of **8.29 percentage points**.
2. The Y-axis scale suggests accuracies are measured on a 0–100% scale, though only 40–50% is visible.
3. No error bars or confidence intervals are shown, limiting interpretation of statistical significance.
### Interpretation
The data suggests that the **Greedy algorithm** is more effective than **PathPieceL** for the task measured by Overall Accuracy. The stark difference implies potential trade-offs: Greedy may prioritize speed or simplicity at the cost of lower accuracy, while PathPieceL might involve more complex computations yielding suboptimal results here. Without additional context (e.g., dataset size, task complexity), the reasons for the disparity remain speculative. The absence of error margins or sample sizes weakens conclusions about reliability.