## Line Chart: Audio Quality vs. Number of Iterations
### Overview
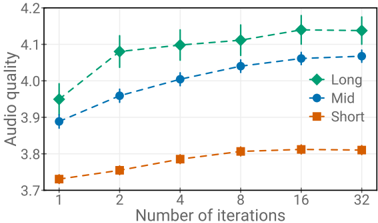
The chart illustrates the relationship between the number of iterations and audio quality across three categories: Long, Mid, and Short. Audio quality is measured on a scale from 3.7 to 4.2, with iterations increasing exponentially (1, 2, 4, 8, 16, 32). Each category is represented by a distinct line style and color.
### Components/Axes
- **X-axis**: "Number of iterations" (logarithmic scale: 1, 2, 4, 8, 16, 32).
- **Y-axis**: "Audio quality" (linear scale: 3.7 to 4.2).
- **Legend**: Located in the top-right corner, mapping:
- **Green diamonds**: Long
- **Blue circles**: Mid
- **Orange squares**: Short
- **Error bars**: Vertical lines extending from data points, indicating uncertainty (approximate ±0.05–0.1).
### Detailed Analysis
1. **Long (Green Diamonds)**:
- Starts at **3.95** (iteration 1) and increases steadily to **4.15** (iteration 32).
- Trend: Consistent upward slope with minimal fluctuation.
- Data points: 3.95, 4.08, 4.10, 4.12, 4.14, 4.15.
2. **Mid (Blue Circles)**:
- Begins at **3.90** (iteration 1) and rises to **4.08** (iteration 32).
- Trend: Gradual increase with a plateau after iteration 16.
- Data points: 3.90, 3.95, 4.00, 4.05, 4.07, 4.08.
3. **Short (Orange Squares)**:
- Starts at **3.72** (iteration 1), peaks at **3.82** (iteration 8), then declines slightly to **3.81** (iteration 32).
- Trend: Flat with a minor dip after iteration 8.
- Data points: 3.72, 3.75, 3.78, 3.82, 3.82, 3.81.
### Key Observations
- **Long** consistently outperforms other categories, achieving the highest audio quality.
- **Mid** shows diminishing returns after iteration 16, stabilizing near 4.07–4.08.
- **Short** exhibits the least improvement, with a marginal decline after iteration 8.
- Error bars suggest greater variability in **Short** compared to **Long** and **Mid**.
### Interpretation
The data suggests that increasing iterations improves audio quality, particularly for the **Long** category. **Mid** demonstrates moderate gains but plateaus, while **Short** shows minimal progress and potential instability. The logarithmic iteration scale implies that early iterations yield significant improvements, but later iterations offer diminishing benefits. The **Short** category’s slight decline after iteration 8 may indicate overfitting or resource constraints. Overall, the chart highlights the importance of iteration count in optimizing audio quality, with **Long** being the most effective approach.