## Line Graph: Test AUROC vs k-top Eigenvalues
### Overview
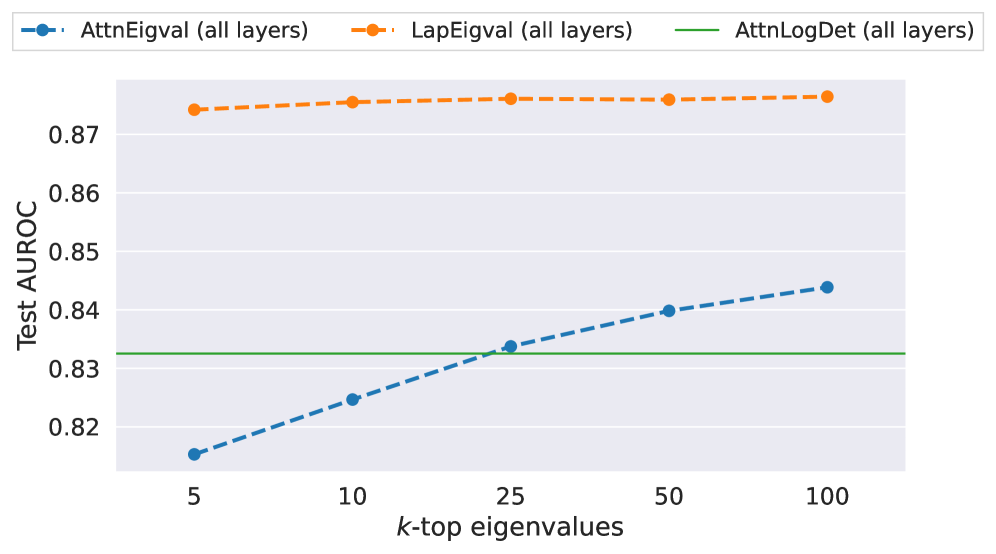
The graph compares three methods (AttnEigval, LapEigval, AttnLogDet) across different k-top eigenvalue thresholds (5, 10, 25, 50, 100) using Test AUROC as the metric. All lines represent "all layers" configurations.
### Components/Axes
- **X-axis**: "k-top eigenvalues" with markers at 5, 10, 25, 50, 100
- **Y-axis**: "Test AUROC" scaled from 0.82 to 0.87 in 0.01 increments
- **Legend**: Top-left corner with three entries:
- Blue dots: AttnEigval (all layers)
- Orange dashed: LapEigval (all layers)
- Green solid: AttnLogDet (all layers)
### Detailed Analysis
1. **LapEigval (orange dashed)**:
- Maintains near-constant performance at ~0.87 across all k-values
- Slight upward trend: 0.872 (k=5) → 0.874 (k=10) → 0.875 (k=25) → 0.875 (k=50) → 0.876 (k=100)
2. **AttnEigval (blue dots)**:
- Starts at 0.815 (k=5) and increases steadily
- Key points: 0.825 (k=10), 0.833 (k=25), 0.840 (k=50), 0.845 (k=100)
- Linear progression with ~0.003 AUROC gain per 10x k increase
3. **AttnLogDet (green solid)**:
- Horizontal line at 0.83 across all k-values
- No variation observed between thresholds
### Key Observations
- LapEigval demonstrates superior stability and performance across all k-values
- AttnEigval shows consistent improvement with larger k-values but remains below LapEigval
- AttnLogDet maintains a fixed performance level independent of k
- All methods operate within a narrow AUROC range (0.815-0.876)
### Interpretation
The data suggests:
1. **LapEigval** provides optimal performance regardless of eigenvalue threshold selection
2. **AttnEigval** benefits from larger k-values but requires careful threshold tuning
3. **AttnLogDet**'s constant performance indicates potential limitations in eigenvalue sensitivity
4. The 0.055 AUROC gap between LapEigval and AttnLogDet at k=5 highlights significant methodological differences
The graph reveals that eigenvalue-based methods (AttnEigval/LapEigval) outperform log-determinant approaches (AttnLogDet), with LapEigval maintaining consistent superiority across all tested configurations.