## Line Chart: Pass@1(%) vs. Number of Alternative Tokens
### Overview
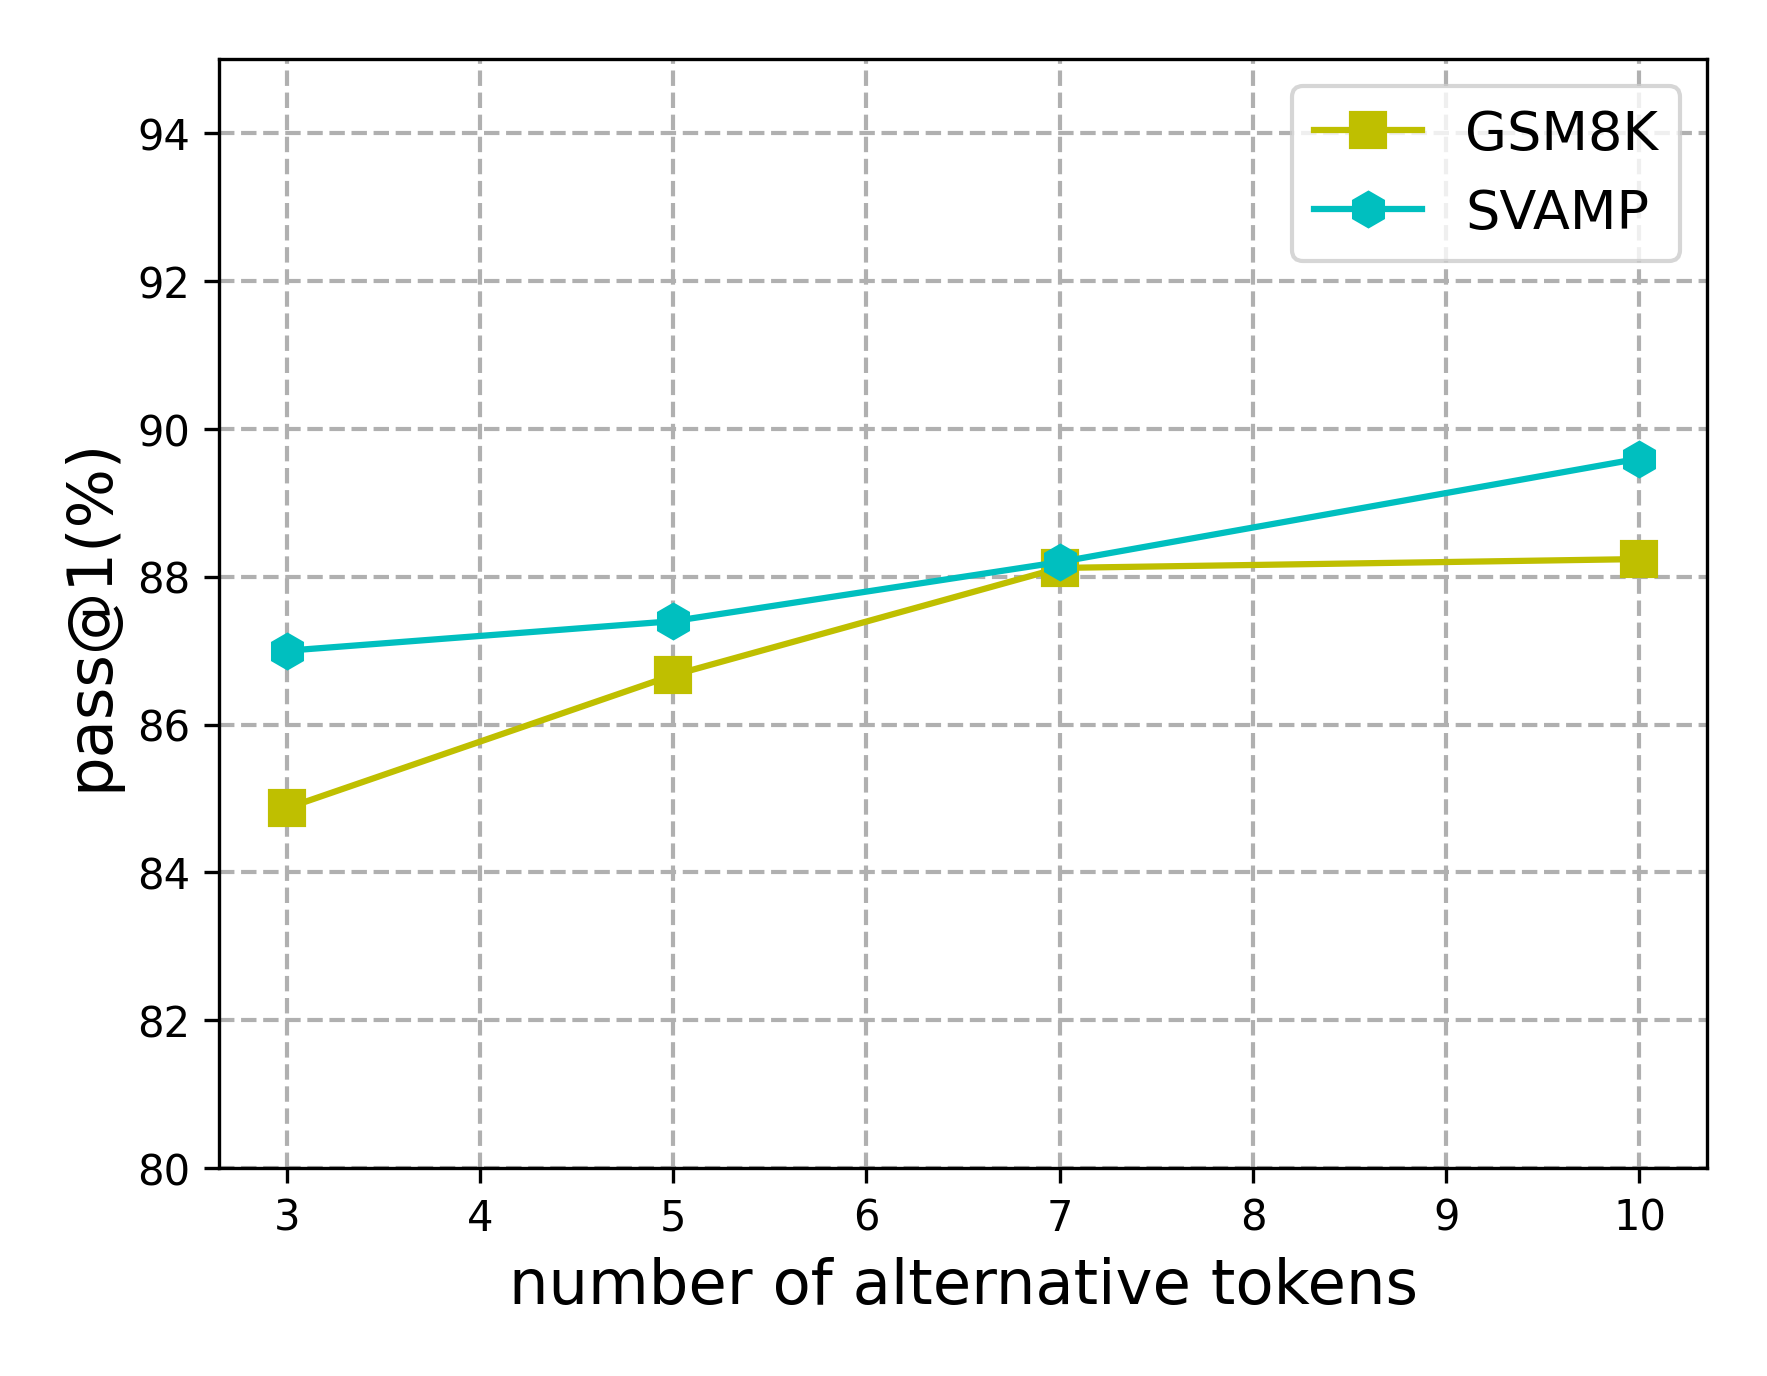
The image is a line chart comparing the performance of two models, GSM8K and SVAMP, based on the "pass@1(%)" metric against the "number of alternative tokens." The chart displays two lines, one for each model, showing how the pass@1(%) score changes as the number of alternative tokens increases.
### Components/Axes
* **X-axis:** "number of alternative tokens" ranging from 3 to 10, with tick marks at each integer value.
* **Y-axis:** "pass@1(%)" ranging from 80 to 94, with tick marks at each even integer value.
* **Legend:** Located in the top-right corner, it identifies the two models:
* GSM8K (yellow-gold line with square markers)
* SVAMP (turquoise line with diamond markers)
* **Gridlines:** Dashed gray lines are present for both x and y axes.
### Detailed Analysis
* **GSM8K (Yellow-Gold Line):**
* Trend: Generally increasing, but plateaus after 7 tokens.
* Data Points:
* At 3 tokens: approximately 84.8%
* At 5 tokens: approximately 86.6%
* At 7 tokens: approximately 88.2%
* At 10 tokens: approximately 88.2%
* **SVAMP (Turquoise Line):**
* Trend: Consistently increasing.
* Data Points:
* At 3 tokens: approximately 87.0%
* At 5 tokens: approximately 87.4%
* At 7 tokens: approximately 88.2%
* At 10 tokens: approximately 89.6%
### Key Observations
* SVAMP consistently outperforms GSM8K across all tested numbers of alternative tokens.
* GSM8K's performance plateaus after 7 alternative tokens, while SVAMP continues to improve.
* Both models show improvement in pass@1(%) as the number of alternative tokens increases, up to a point.
### Interpretation
The chart suggests that increasing the number of alternative tokens generally improves the performance of both GSM8K and SVAMP models, as measured by the pass@1(%) metric. However, the effect is more pronounced for SVAMP, which shows a consistent upward trend, while GSM8K's performance plateaus. This could indicate that SVAMP is better able to leverage additional alternative tokens to improve its accuracy, or that GSM8K reaches a saturation point beyond which more tokens do not provide significant benefit. The data implies that SVAMP is the superior model for this particular task and metric, within the tested range of alternative tokens.