\n
## Bar Chart with Line Overlay: Average Coherence Scores by LLM and Response Type
### Overview
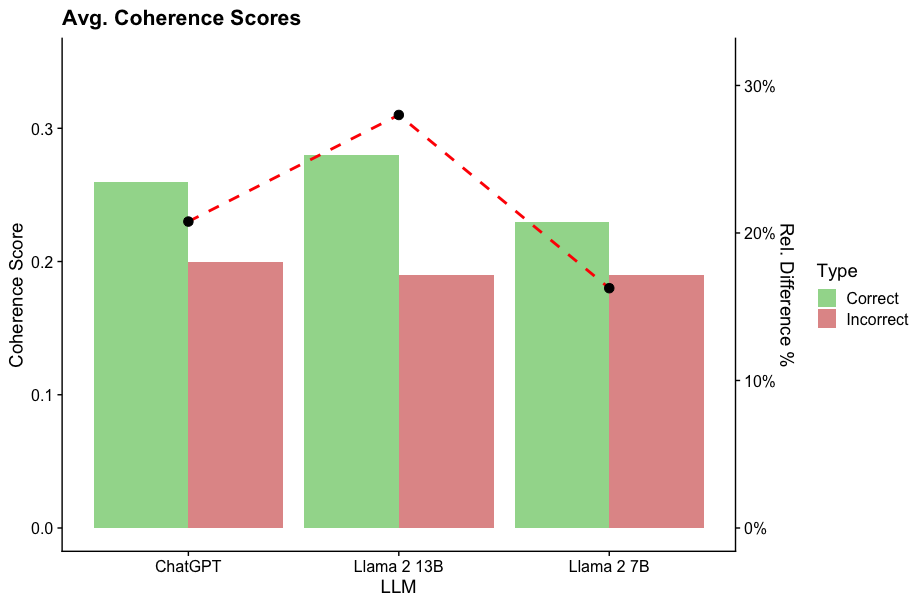
The image is a dual-axis chart comparing the average coherence scores of three Large Language Models (LLMs) for "Correct" versus "Incorrect" responses. It also plots the relative percentage difference between these two scores for each model. The chart uses grouped bars for the scores and a dashed line for the percentage difference.
### Components/Axes
* **Title:** "Avg. Coherence Scores" (top-left).
* **Primary Y-Axis (Left):** Labeled "Coherence Score". Scale ranges from 0.0 to approximately 0.35, with major ticks at 0.0, 0.1, 0.2, and 0.3.
* **Secondary Y-Axis (Right):** Labeled "Rel. Difference %". Scale ranges from 0% to approximately 35%, with major ticks at 0%, 10%, 20%, and 30%.
* **X-Axis:** Labeled "LLM". Three categories are listed: "ChatGPT", "Llama 2 13B", and "Llama 2 7B".
* **Legend:** Positioned on the right side of the chart, titled "Type". It defines two categories:
* **Correct:** Represented by a light green color.
* **Incorrect:** Represented by a light red/salmon color.
* **Data Series:**
1. **Grouped Bars:** For each LLM, two bars are shown side-by-side. The left (green) bar represents the average coherence score for "Correct" responses. The right (red) bar represents the average coherence score for "Incorrect" responses.
2. **Line Overlay:** A dashed red line with black circular markers connects data points representing the "Rel. Difference %" for each LLM. This line is plotted against the right-hand Y-axis.
### Detailed Analysis
**1. ChatGPT:**
* **Correct (Green Bar):** Coherence Score ≈ 0.26.
* **Incorrect (Red Bar):** Coherence Score ≈ 0.20.
* **Rel. Difference % (Line Marker):** ≈ 20%. The black dot is positioned at the 20% tick on the right axis.
**2. Llama 2 13B:**
* **Correct (Green Bar):** Coherence Score ≈ 0.28 (the highest "Correct" score on the chart).
* **Incorrect (Red Bar):** Coherence Score ≈ 0.19.
* **Rel. Difference % (Line Marker):** ≈ 30%. The black dot is positioned at the 30% tick on the right axis, representing the peak of the dashed line.
**3. Llama 2 7B:**
* **Correct (Green Bar):** Coherence Score ≈ 0.23.
* **Incorrect (Red Bar):** Coherence Score ≈ 0.19.
* **Rel. Difference % (Line Marker):** ≈ 18%. The black dot is positioned slightly below the 20% tick on the right axis.
**Trend Verification:**
* For all three LLMs, the "Correct" (green) bar is taller than the "Incorrect" (red) bar, indicating a consistent trend of higher coherence scores for correct responses.
* The dashed red line (Rel. Difference %) slopes upward from ChatGPT to Llama 2 13B, then slopes downward to Llama 2 7B, forming a peak at the 13B model.
### Key Observations
1. **Consistent Performance Gap:** Every model shows a higher average coherence score for correct responses compared to incorrect ones.
2. **Peak Difference at Llama 2 13B:** The relative difference between correct and incorrect coherence scores is largest for Llama 2 13B (~30%), significantly higher than for ChatGPT (~20%) or Llama 2 7B (~18%).
3. **Highest Absolute Score:** Llama 2 13B also achieves the highest absolute coherence score for correct responses (~0.28).
4. **Similar "Incorrect" Scores:** The coherence scores for incorrect responses are relatively similar across all three models, clustering around 0.19-0.20.
### Interpretation
This chart suggests that while all evaluated LLMs produce more coherent text when their responses are correct, the magnitude of this coherence gap varies by model. The data indicates that **Llama 2 13B exhibits the most pronounced distinction in text quality between its correct and incorrect outputs.** This could imply that this model's architecture or training leads to a sharper degradation in linguistic coherence when it fails, compared to ChatGPT or the smaller Llama 2 7B model.
The fact that the "Incorrect" coherence scores are similar across models, while the "Correct" scores vary more, suggests that the models' baseline ability to generate fluent but wrong text is comparable, but their peak performance on correct answers differs. The Llama 2 13B model appears to have a higher ceiling for coherence when it is accurate. This information is valuable for understanding model behavior beyond simple accuracy metrics, highlighting how reliability and output quality are intertwined.