## Heatmap: Distribution of Terms Across Layers
### Overview
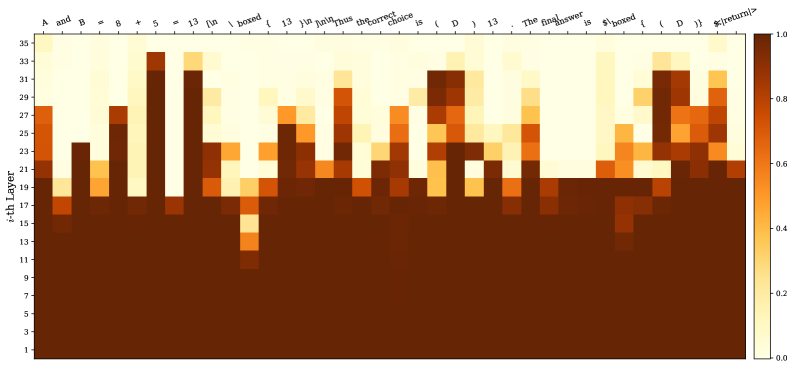
The image is a heatmap visualizing the distribution of specific textual terms across 35 layers (y-axis) and 15 categories (x-axis). The color intensity ranges from dark brown (0.0) to light yellow (1.0), indicating the magnitude of values associated with each term-layer combination.
### Components/Axes
- **Y-axis (i-th Layer)**: Labeled "i-th Layer" with values from 1 to 35, representing discrete layers.
- **X-axis (Categories)**: Labeled with the following terms (left to right):
1. "A and B = 8 + 5 = 13"
2. "fun"
3. "boxed"
4. "13"
5. "in"
6. "July"
7. "Thus"
8. "the correct choice is"
9. "D"
10. "13 ."
11. "The final answer is"
12. "$boxed"
13. "13"
14. "D"
15. "$return>"
- **Color Legend**: Located on the right, with a gradient from dark brown (0.0) to light yellow (1.0). The legend is labeled with numerical values (0.0, 0.2, 0.4, 0.6, 0.8, 1.0).
### Detailed Analysis
- **X-axis Categories**:
- "A and B = 8 + 5 = 13": High values (light yellow) in layers 33–35, with a peak at layer 33.
- "boxed": High values in layers 33–35, with a peak at layer 33.
- "13": Moderate values (orange) in layers 15–25, with a peak at layer 25.
- "in", "July", "Thus": Low values (dark brown) across most layers, with slight increases in layers 25–30.
- "the correct choice is": High values in layers 33–35, with a peak at layer 33.
- "D": High values in layers 33–35, with a peak at layer 33.
- "13 .": Moderate values in layers 15–25, with a peak at layer 25.
- "The final answer is": High values in layers 33–35, with a peak at layer 33.
- "$boxed": High values in layers 33–35, with a peak at layer 33.
- "$return>": High values in layers 33–35, with a peak at layer 33.
- **Y-axis Layers**:
- Layers 1–10: Dominated by dark brown (low values) across most categories.
- Layers 15–25: Moderate values (orange) in "13", "13 .", and "D".
- Layers 33–35: High values (light yellow) in "A and B = 8 + 5 = 13", "boxed", "the correct choice is", "D", "$boxed", and "$return>".
### Key Observations
1. **Peaks in Top Layers**: The highest values (light yellow) are concentrated in layers 33–35 for categories like "A and B = 8 + 5 = 13", "boxed", "the correct choice is", "D", "$boxed", and "$return>".
2. **Moderate Values in Middle Layers**: Layers 15–25 show moderate values (orange) for "13", "13 .", and "D".
3. **Low Values in Bottom Layers**: Layers 1–10 are predominantly dark brown, indicating minimal activity or significance.
4. **Anomalies**: The category "13" has a distinct peak at layer 25, while "D" shows peaks at layers 25 and 33.
### Interpretation
The heatmap suggests a hierarchical or layered structure where certain terms (e.g., mathematical expressions, final answers) gain prominence in higher layers. The repeated appearance of "13" and "D" in middle and top layers may indicate critical nodes or decision points. The dominance of dark brown in lower layers implies these layers are less dynamic or less significant in the context of the data. The peaks in layers 33–35 for terms like "the final answer is" and "$return>" suggest these layers represent conclusions or outputs in a process. The use of mathematical notation (e.g., "A and B = 8 + 5 = 13") and programming-like syntax (e.g., "$boxed", "$return>") hints at a computational or algorithmic context, possibly related to code analysis or natural language processing.