## 3D Bar Chart: Channel vs Token Absolute Values
### Overview
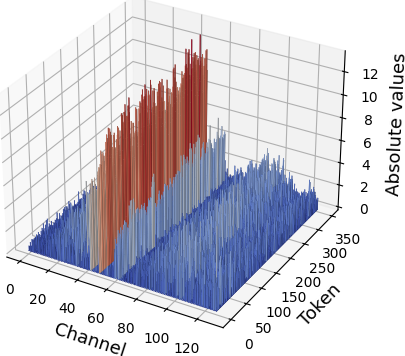
The image depicts a 3D bar chart visualizing absolute values across two channels (Channel 1 and Channel 2) over a range of tokens (0–350). The chart uses vertical bars to represent magnitude, with distinct color coding for each channel. The z-axis (Absolute values) ranges from 0 to 12, while the x-axis (Channel) spans 0–120 and the y-axis (Token) spans 0–350.
### Components/Axes
- **X-axis (Channel)**: Labeled "Channel," scaled from 0 to 120 in increments of 20.
- **Y-axis (Token)**: Labeled "Token," scaled from 0 to 350 in increments of 50.
- **Z-axis (Absolute values)**: Labeled "Absolute values," scaled from 0 to 12 in increments of 2.
- **Legend**: Located on the right side of the chart, with:
- **Red**: Represents "Channel 1."
- **Blue**: Represents "Channel 2."
### Detailed Analysis
- **Channel 1 (Red Bars)**:
- Peaks at approximately **x=100** (Channel) and **y=100** (Token), with a maximum z-value of **~12**.
- Bars are concentrated in the lower half of the y-axis (Tokens 0–200), with diminishing height beyond y=200.
- Intermediate values observed near x=60–80 and y=50–150.
- **Channel 2 (Blue Bars)**:
- Dominates the lower y-axis (Tokens 0–200), with bars reaching up to **~6** on the z-axis.
- Spreads more uniformly across the x-axis (0–120) compared to Channel 1.
- No bars exceed z=6, and density decreases sharply beyond y=200.
### Key Observations
1. **Channel 1 exhibits higher absolute values** than Channel 2, with a clear peak at (x=100, y=100).
2. **Channel 2 shows broader but shallower distribution**, with no values exceeding 6 on the z-axis.
3. **Token range 0–200** is the primary focus for both channels, with minimal activity beyond y=200.
4. **Red bars (Channel 1)** are spatially clustered near the center of the x-axis (x=60–100), while blue bars (Channel 2) are more evenly distributed.
### Interpretation
The data suggests **Channel 1 dominates in specific token regions** (notably around Token 100), potentially indicating higher performance or significance in those areas. The **concentration of red bars** near x=100 and y=100 may reflect a critical threshold or anomaly in Channel 1's behavior. In contrast, **Channel 2's uniform but lower values** imply a more stable but less impactful contribution across tokens. The absence of data beyond Token 200 for both channels raises questions about whether this range represents a cutoff or incomplete sampling. The stark difference in z-axis magnitudes (12 vs. 6) highlights a **2:1 ratio in peak values**, which could signify a hierarchical relationship between the channels.