## Bar Chart: Normalized Total Energy Across Datasets and Models
### Overview
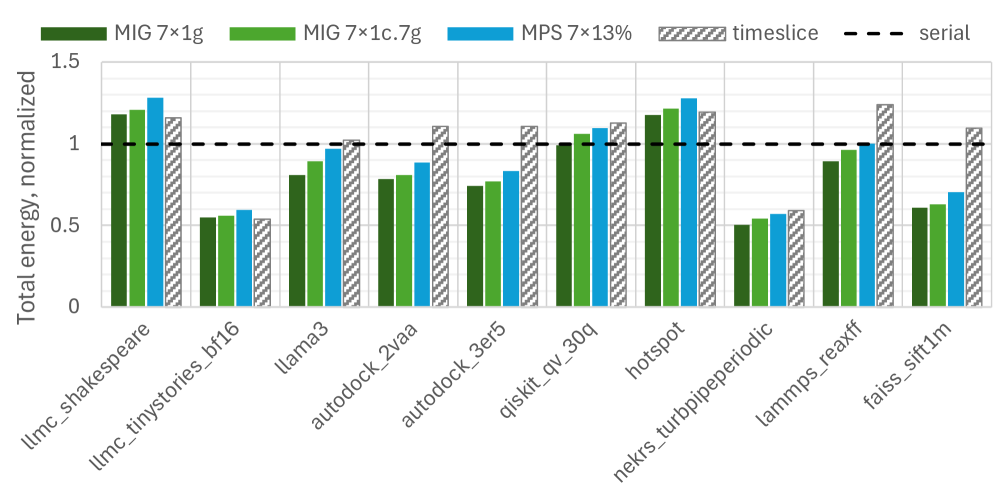
The chart compares normalized total energy consumption across 10 datasets using four computational models: MIG 7x1g, MIG 7x1.7g, MPS 7x13%, and timeslice. A dashed line at 1.0 represents the "serial" baseline. Bars are grouped by dataset, with each model represented by distinct colors (dark green, light green, blue, gray).
### Components/Axes
- **X-axis**: Datasets (e.g., `llmc_shakespeare`, `llmc_tinystories_bf16`, `llama3`, `autodock_2vaa`, `autodock_3er5`, `qiskit_qv_30q`, `hotspot`, `neks_turbpipeperiodic`, `lammp_reaxff`, `faiss_sift1m`).
- **Y-axis**: "Total energy, normalized" (scale: 0 to 1.5).
- **Legend**:
- Dark green: MIG 7x1g
- Light green: MIG 7x1.7g
- Blue: MPS 7x13%
- Gray: timeslice
- Dashed line: serial (baseline at 1.0).
### Detailed Analysis
1. **Dataset Performance**:
- **`llmc_shakespeare`**: Highest energy consumption (~1.2–1.3 for MIG 7x1g and MPS 7x13%).
- **`llmc_tinystories_bf16`**: Lowest energy (~0.5–0.6 for all models).
- **`hotspot`**: Peaks for MIG 7x1g (~1.2) and MPS 7x13% (~1.3).
- **`neks_turbpipeperiodic`**: Lowest values (~0.5–0.6 for all models).
- **`lammp_reaxff`**: MIG 7x1g (~0.9) and MPS 7x13% (~1.0) dominate.
- **`faiss_sift1m`**: MIG 7x1g (~0.6) and MPS 7x13% (~0.7) show moderate performance.
2. **Model Trends**:
- **MIG 7x1g** (dark green): Consistently highest or near-highest values across most datasets.
- **MPS 7x13%** (blue): Second-highest performance, often trailing MIG 7x1g.
- **MIG 7x1.7g** (light green): Slightly lower than MIG 7x1g but outperforms timeslice.
- **timeslice** (gray): Near-baseline performance (~0.8–1.1), slightly above serial in some cases.
- **serial** (dashed line): Baseline at 1.0; most models exceed this except in low-energy datasets.
### Key Observations
- **Outliers**:
- `llmc_shakespeare` and `hotspot` show extreme energy consumption for MIG 7x1g and MPS 7x13%.
- `neks_turbpipeperiodic` and `llmc_tinystories_bf16` exhibit uniformly low energy use.
- **Trends**:
- MIG 7x1g and MPS 7x13% generally outperform other models, suggesting higher computational efficiency.
- timeslice performs closer to the serial baseline, indicating minimal parallelization gains in some cases.
### Interpretation
The chart demonstrates that MIG 7x1g and MPS 7x13% models achieve the highest normalized energy efficiency across most datasets, with MIG 7x1g leading in high-energy tasks like `llmc_shakespeare` and `hotspot`. The timeslice model shows mixed results, performing near-baseline in low-energy datasets but slightly better in others. The serial baseline (1.0) serves as a reference, highlighting that most models reduce energy consumption compared to sequential processing. Notably, `neks_turbpipeperiodic` and `llmc_tinystories_bf16` require minimal energy across all models, suggesting inherent efficiency in these tasks. The data implies that model choice significantly impacts energy efficiency, with MIG 7x1g being the most resource-intensive but potentially optimal for complex workloads.