## Diagram: Shape and Color Progression
### Overview
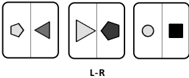
The image consists of three horizontally aligned sections, each divided into two parts by a vertical line. Each section contains a pair of geometric shapes with distinct colors and sizes. Below the sections, the label "L-R" is present, suggesting a left-to-right progression or comparison.
### Components/Axes
- **Sections**: Three distinct regions labeled implicitly by position (left, middle, right).
- **Shapes**:
- **Left Section**: Pentagon (light gray) and triangle (dark gray).
- **Middle Section**: Triangle (light gray) and hexagon (dark gray).
- **Right Section**: Circle (light gray) and square (black).
- **Colors**:
- Light gray (used for pentagon, triangle, and circle).
- Dark gray (used for triangle and hexagon).
- Black (used for square).
- **Text**: The label "L-R" is centered below the three sections.
### Detailed Analysis
1. **Shape Complexity**:
- Left to right, shapes increase in complexity:
- Pentagon (5 sides) → Triangle (3 sides) → Hexagon (6 sides) → Circle (infinite sides) → Square (4 sides).
- Note: The middle section’s triangle and hexagon deviate from the left-to-right size progression (triangle is larger than the pentagon, hexagon is smaller than the triangle).
2. **Color Pattern**:
- Alternating light gray and dark gray dominate, with the exception of the black square in the right section.
- The black square is the only fully filled shape, contrasting with the outlined shapes in other sections.
3. **Size Variation**:
- Left section: Pentagon (small) and triangle (larger).
- Middle section: Triangle (largest) and hexagon (smaller than triangle).
- Right section: Circle (small) and square (larger).
### Key Observations
- **Inconsistent Size Progression**: The middle section’s triangle is larger than the left section’s triangle, breaking the apparent size trend.
- **Color Contrast**: The black square stands out as the only non-outlined shape, potentially signifying a categorical difference.
- **Label Ambiguity**: "L-R" could imply a directional relationship (e.g., left-to-right comparison) but lacks explicit context.
### Interpretation
The image likely illustrates a conceptual progression or comparison of geometric shapes, emphasizing differences in complexity, size, and color. The inconsistent size scaling in the middle section suggests intentional design to highlight specific relationships (e.g., triangle-hexagon contrast). The black square’s distinct color and fill style may denote a unique category or endpoint in the sequence. The absence of numerical data or explicit labels limits quantitative analysis, leaving interpretation reliant on visual patterns.
## Notes
- No numerical data, axes, or legends are present.
- The image focuses on qualitative comparisons rather than quantitative metrics.
- The "L-R" label requires additional context to clarify its purpose (e.g., directional flow, categorical grouping).