# Technical Document Extraction: Scatter Plot Analysis
## Chart Overview
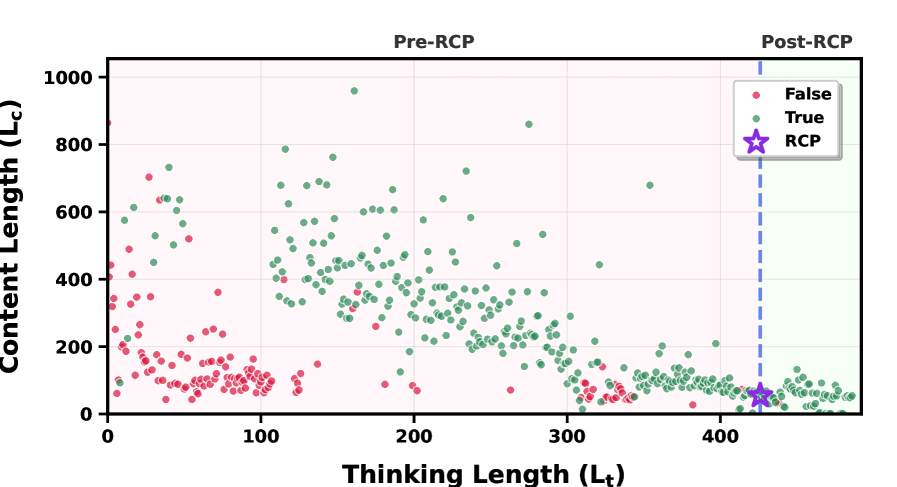
The image depicts a **scatter plot** comparing **Thinking Length (Lt)** and **Content Length (Lc)** across two regions: **Pre-RCP** and **Post-RCP**. Key elements include:
- **Axes**:
- **X-axis**: Thinking Length (Lt) [0, 400]
- **Y-axis**: Content Length (Lc) [0, 1000]
- **Regions**:
- **Pre-RCP**: Left of dashed blue vertical line at Lt = 400
- **Post-RCP**: Right of dashed blue vertical line at Lt = 400
## Legend
- **Location**: Top-right corner
- **Labels**:
- **Red**: False
- **Green**: True
- **Purple Star**: RCP
## Data Points and Trends
### False (Red Dots)
- **Pre-RCP**: Clustered in the lower-left quadrant (Lt: 0–100, Lc: 0–200).
- **Post-RCP**: Sparse distribution (Lt: 300–400, Lc: 50–150).
- **Trend**: Decreasing density in Post-RCP compared to Pre-RCP.
### True (Green Dots)
- **Pre-RCP**: Scattered across mid-to-upper regions (Lt: 100–300, Lc: 200–800).
- **Post-RCP**: Concentrated near the dashed line (Lt: 300–400, Lc: 100–400).
- **Trend**: Increased density in Post-RCP, with a gradient toward lower Lc values.
### RCP (Purple Star)
- **Location**: [420, 50] (outside Post-RCP region, slightly right of the dashed line).
- **Significance**: Single outlier point, distinct from other data series.
## Spatial Grounding
- **Legend**: Top-right corner (coordinates not explicitly defined).
- **RCP Star**: Positioned at [420, 50], outside the Post-RCP region.
## Component Isolation
1. **Header**: Chart title "Pre-RCP" and "Post-RCP" labels above the regions.
2. **Main Chart**:
- Scatter plot with color-coded data points.
- Dashed blue line at Lt = 400.
3. **Footer**: No explicit footer; legend serves as a reference.
## Verification
- **Legend Consistency**:
- Red (False) matches lower-left clusters.
- Green (True) aligns with mid-to-upper clusters.
- Purple star (RCP) is isolated at [420, 50].
- **Trend Validation**:
- False points decline in Post-RCP.
- True points increase in Post-RCP, with a downward trend in Lc.
## Notes
- No additional languages or textual blocks present.
- All data points and labels are explicitly mapped to their respective categories.