## Candlestick Chart: Price Fluctuations
### Overview
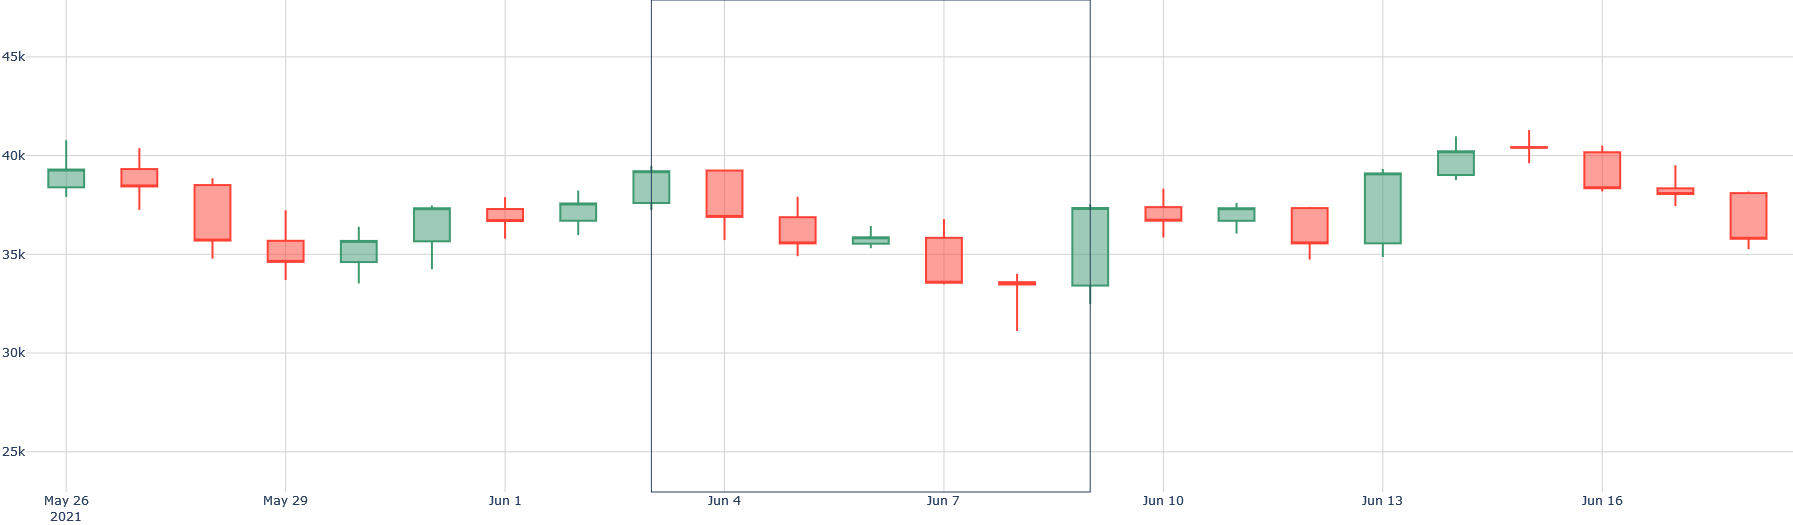
The image presents a candlestick chart illustrating price fluctuations over time. The chart spans from May 26, 2021, to June 16, 2021. Each candlestick represents a trading day, with green candles indicating a price increase and red candles indicating a price decrease. The y-axis represents the price in thousands (k).
### Components/Axes
* **X-axis:** Represents time, with labels indicating specific dates: May 26 2021, May 29, Jun 1, Jun 4, Jun 7, Jun 10, Jun 13, Jun 16.
* **Y-axis:** Represents price, with markers at 25k, 30k, 35k, 40k, and 45k.
* **Candlesticks:** Each candlestick shows the open, close, high, and low prices for a specific day.
* **Green Candlesticks:** Indicate that the closing price was higher than the opening price.
* **Red Candlesticks:** Indicate that the closing price was lower than the opening price.
* **Vertical Rectangle:** A vertical rectangle spans from approximately June 3 to June 9.
### Detailed Analysis
* **May 26, 2021:** Green candlestick, indicating a price increase. The body of the candle is approximately between 38k and 40k.
* **May 29:** Red candlestick, indicating a price decrease. The body of the candle is approximately between 35k and 39k.
* **Jun 1:** Green candlestick, indicating a price increase. The body of the candle is approximately between 36k and 37k.
* **Jun 4:** Red candlestick, indicating a price decrease. The body of the candle is approximately between 36k and 39k.
* **Jun 7:** Red candlestick, indicating a price decrease. The body of the candle is approximately between 34k and 36k.
* **Jun 10:** Green candlestick, indicating a price increase. The body of the candle is approximately between 34k and 37k.
* **Jun 13:** Green candlestick, indicating a price increase. The body of the candle is approximately between 37k and 39k.
* **Jun 16:** Red candlestick, indicating a price decrease. The body of the candle is approximately between 36k and 40k.
### Key Observations
* The price fluctuates between approximately 33k and 41k during the observed period.
* There are periods of both increasing and decreasing prices, as indicated by the alternating green and red candlesticks.
* The vertical rectangle highlights a period of price volatility or specific interest between June 3 and June 9.
### Interpretation
The candlestick chart provides a visual representation of price movements over a short period. The alternating green and red candlesticks suggest a market with frequent changes in sentiment. The vertical rectangle could indicate a period of increased trading volume, news events, or other factors that influenced price fluctuations. The chart does not provide information about the specific asset being tracked, but it offers insights into its price behavior during the specified timeframe.