TECHNICAL ASSET FINGERPRINT
33f953d004e43254938f11b6
Click to view fullscreen
Press ESC or click to close
FOUND IN PAPERS
EXPERT: healer-alpha-free VERSION 1
RUNTIME: free/openrouter/healer-alpha
INTEL_VERIFIED
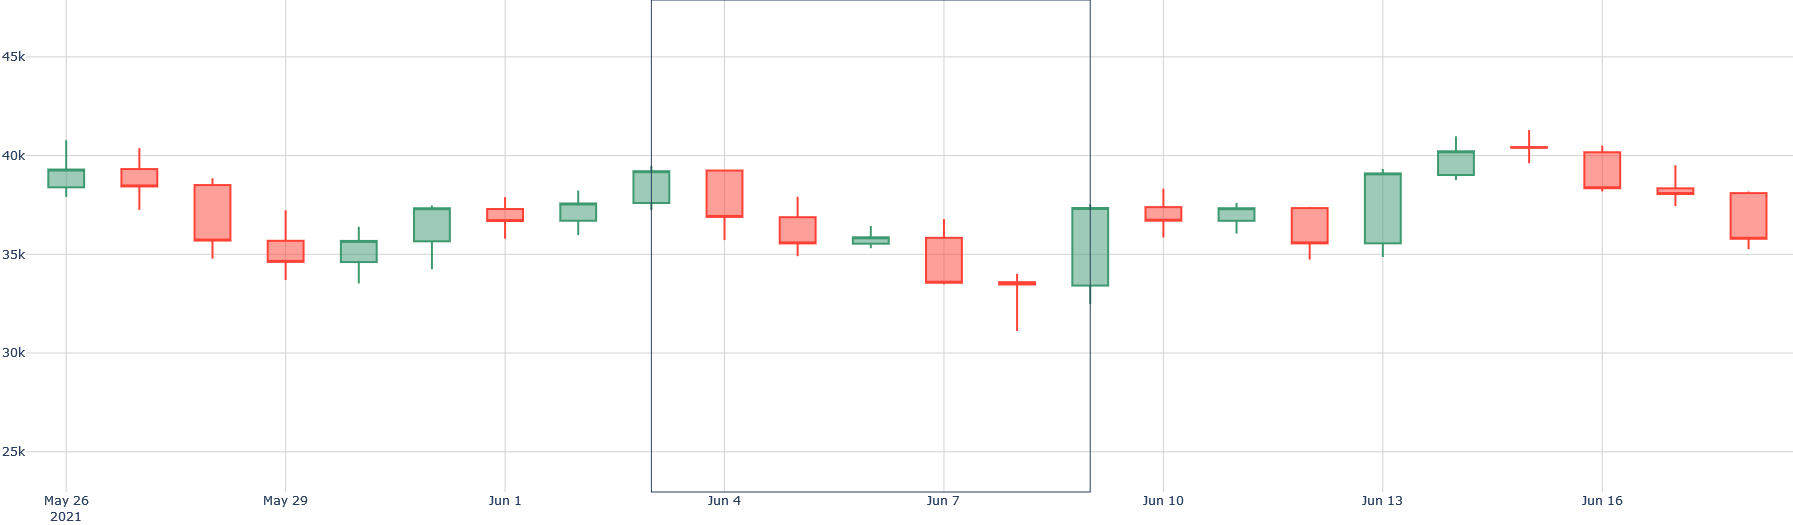
## Candlestick Chart: Price Movement (May 26 - June 16, 2021)
### Overview
This is a financial candlestick chart displaying price action over a period of approximately three weeks, from late May to mid-June 2021. The chart shows daily price movements, with each candlestick representing one trading day. The asset or instrument being tracked is not explicitly labeled on the chart.
### Components/Axes
* **X-Axis (Horizontal):** Represents time. Major date labels are present at the bottom: `May 26 2021`, `May 29`, `Jun 1`, `Jun 4`, `Jun 7`, `Jun 10`, `Jun 13`, `Jun 16`. The axis is linear, with each candlestick corresponding to a single day.
* **Y-Axis (Vertical):** Represents price. Major labels are on the left side: `25k`, `30k`, `35k`, `40k`, `45k`. The scale is linear, with gridlines at 5k intervals.
* **Candlesticks:** Each candlestick has a rectangular body and vertical lines (wicks/shadows) extending above and below.
* **Green (Teal) Candlesticks:** Indicate a bullish day where the closing price was higher than the opening price. The body spans from the open (bottom) to the close (top).
* **Red (Salmon) Candlesticks:** Indicate a bearish day where the closing price was lower than the opening price. The body spans from the open (top) to the close (bottom).
* **Wicks:** Show the highest and lowest prices reached during the trading session.
* **Legend:** No explicit legend is present. The color coding (green for up, red for down) is standard for candlestick charts.
* **Highlight Box:** A faint, semi-transparent grey rectangle is overlaid on the chart, spanning from approximately June 3 to June 9. This appears to be a user-added annotation to highlight a specific period of interest.
### Detailed Analysis
The chart displays a sequence of daily price actions. Below is a chronological breakdown of each visible candlestick, from left to right. Prices are approximate visual estimates.
1. **May 26 (Green):** Open ~38.5k, Close ~39.5k. High wick to ~40.5k, low wick to ~38k. Bullish start.
2. **May 27 (Red):** Open ~39.5k, Close ~38.5k. High wick to ~40k, low wick to ~37.5k. Slight pullback.
3. **May 28 (Red):** Open ~38.5k, Close ~36k. High wick to ~39k, low wick to ~35.5k. Significant bearish move.
4. **May 29 (Red):** Open ~36k, Close ~35k. High wick to ~36.5k, low wick to ~34.5k. Continued decline.
5. **May 30 (Green):** Open ~35k, Close ~35.5k. High wick to ~36.5k, low wick to ~34.5k. Small recovery.
6. **May 31 (Green):** Open ~35.5k, Close ~37k. High wick to ~37.5k, low wick to ~35k. Stronger bullish day.
7. **Jun 1 (Red):** Open ~37k, Close ~36.5k. High wick to ~37.5k, low wick to ~36k. Minor bearish day.
8. **Jun 2 (Green):** Open ~36.5k, Close ~37.5k. High wick to ~38k, low wick to ~36k. Recovery continues.
9. **Jun 3 (Green):** Open ~37.5k, Close ~39k. High wick to ~39.5k, low wick to ~37k. Strong bullish move, entering the highlighted zone.
10. **Jun 4 (Red):** Open ~39k, Close ~37k. High wick to ~39.5k, low wick to ~36.5k. Sharp reversal within the highlight.
11. **Jun 5 (Red):** Open ~37k, Close ~36k. High wick to ~37.5k, low wick to ~35.5k. Continued decline.
12. **Jun 6 (Green - Doji-like):** Open ~36k, Close ~36k. Very small body. High wick to ~36.5k, low wick to ~35.5k. Indecision.
13. **Jun 7 (Red):** Open ~36k, Close ~34k. High wick to ~36.5k, low wick to ~33.5k. Strong bearish day.
14. **Jun 8 (Red - Long Lower Wick):** Open ~34k, Close ~33.5k. High wick to ~34.5k, **low wick extends down to ~31k**. This is the lowest point on the chart, showing a dramatic intraday drop followed by a recovery.
15. **Jun 9 (Green):** Open ~33.5k, Close ~37.5k. High wick to ~38k, low wick to ~33k. **Very strong bullish reversal**, exiting the highlight zone.
16. **Jun 10 (Red):** Open ~37.5k, Close ~37k. High wick to ~38k, low wick to ~36.5k. Small bearish consolidation.
17. **Jun 11 (Green):** Open ~37k, Close ~37.5k. High wick to ~38k, low wick to ~36.5k. Small bullish day.
18. **Jun 12 (Red):** Open ~37.5k, Close ~36.5k. High wick to ~38k, low wick to ~36k. Minor pullback.
19. **Jun 13 (Green):** Open ~36.5k, Close ~39k. High wick to ~39.5k, low wick to ~36k. Strong bullish move.
20. **Jun 14 (Green):** Open ~39k, Close ~40k. High wick to ~40.5k, low wick to ~38.5k. Continued strength.
21. **Jun 15 (Red - Doji-like):** Open ~40k, Close ~40k. Very small body. High wick to ~40.5k, low wick to ~39.5k. Indecision at highs.
22. **Jun 16 (Red):** Open ~40k, Close ~38.5k. High wick to ~40.5k, low wick to ~38k. Bearish day.
23. **Final Candle (Red):** Open ~38.5k, Close ~37k. High wick to ~39k, low wick to ~36.5k. Further decline.
### Key Observations
* **Overall Trend:** The chart shows a volatile period with a general downtrend from late May (~39.5k) to a low on June 8 (~31k), followed by a strong recovery uptrend to a peak around June 14-15 (~40k), and then a pullback.
* **Highlighted Period (Jun 3-9):** This zone contains the most significant volatility, including the sharpest decline and the strongest single-day recovery (June 9).
* **Notable Candle:** The June 8 candlestick is the most distinctive, with an exceptionally long lower wick indicating a massive intraday sell-off that was strongly rejected, often a technical signal of a potential bottom.
* **Volume:** No volume data is provided on this chart.
### Interpretation
This candlestick chart depicts a classic market cycle of decline, capitulation, and recovery over a short timeframe. The period within the grey highlight box (June 3-9) represents a **selling climax**. The long lower wick on June 8 is a key Peircean signifier of **exhaustion** among sellers and the entry of strong buyers at lower prices, which directly led to the sharp reversal on June 9.
The subsequent rally from June 9 to June 14 demonstrates **bullish momentum** reclaiming the losses from the prior decline. The indecision candles (dojis) on June 6 and June 15 mark potential turning points or pauses in the trend. The final two red candles suggest the rally may have encountered resistance near the 40k level, leading to a new short-term pullback.
The chart tells a story of fear and greed: panic selling early in the highlighted period, a moment of maximum pessimism on June 8, followed by a swift and strong bullish response that drove prices back to the starting point of the decline. The absence of the asset's name limits specific context, but the price action itself is a clear record of shifting market sentiment.
DECODING INTELLIGENCE...