# Technical Document Extraction: Frequency Distribution of Network Traffic Types
## 1. Image Overview
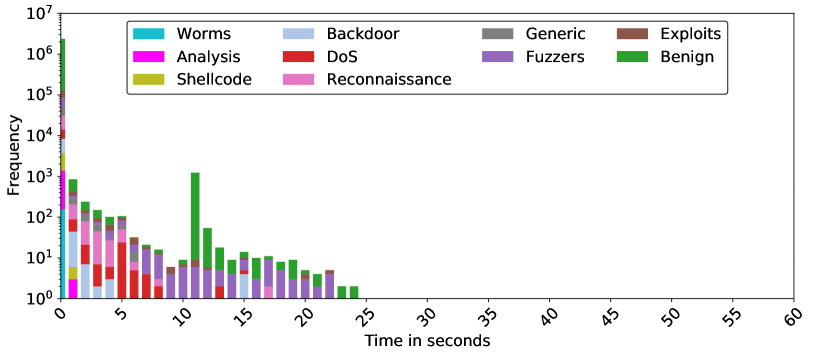
This image is a stacked bar chart representing the frequency of different network traffic categories (both benign and various types of attacks) over a duration of time measured in seconds. The Y-axis uses a logarithmic scale to accommodate a wide range of frequency values.
## 2. Component Isolation
### Header / Legend
* **Location:** Top-center, enclosed in a rounded rectangle.
* **Content:** 10 categories with associated color swatches.
* **Worms:** Cyan
* **Analysis:** Magenta
* **Shellcode:** Olive/Yellow-Green
* **Backdoor:** Light Blue
* **DoS:** Red
* **Reconnaissance:** Pink
* **Generic:** Grey
* **Fuzzers:** Purple
* **Exploits:** Brown
* **Benign:** Green
### Main Chart Area (Axes)
* **Y-Axis (Vertical):**
* **Label:** "Frequency"
* **Scale:** Logarithmic, ranging from $10^0$ (1) to $10^7$ (10,000,000).
* **Major Tick Marks:** $10^0, 10^1, 10^2, 10^3, 10^4, 10^5, 10^6, 10^7$.
* **X-Axis (Horizontal):**
* **Label:** "Time in seconds"
* **Scale:** Linear, ranging from 0 to 60.
* **Major Tick Marks:** Every 5 units (0, 5, 10, 15, 20, 25, 30, 35, 40, 45, 50, 55, 60).
* **Labels:** Rotated 45 degrees for readability.
## 3. Data Trends and Distribution
### General Trend
The data exhibits a heavy "long-tail" distribution. The vast majority of traffic occurs within the first second (0-1s interval). As time increases, the total frequency drops precipitously. No data points are recorded beyond approximately 25 seconds, leaving the 25–60 second range empty.
### Category-Specific Observations
* **Benign (Green):** This is the most frequent category. It dominates the 0-1s bin (reaching over $10^6$) and remains the most consistent category present across the timeline, including a notable spike around the 11-second mark (approx. $10^3$).
* **Attack Traffic (Various Colors):**
* **0-1 Second Bin:** Contains a stack of almost all categories, with total frequency exceeding $10^6$.
* **1-5 Seconds:** Significant presence of **Backdoor (Light Blue)**, **DoS (Red)**, and **Reconnaissance (Pink)**.
* **5-10 Seconds:** **DoS (Red)** and **Fuzzers (Purple)** are prominent.
* **10-25 Seconds:** The frequency drops below $10^2$. **Fuzzers (Purple)** and **Benign (Green)** are the primary categories appearing in these later intervals.
* **Worms (Cyan), Analysis (Magenta), and Shellcode (Olive):** These appear almost exclusively in the first few seconds (0-2s) and are not visible in the later stages of the timeline.
## 4. Estimated Data Points (Log Scale)
| Time Interval (s) | Primary Categories Present | Estimated Total Frequency (Log Scale) |
| :--- | :--- | :--- |
| **0 - 1** | All (Benign dominant) | $> 10^6$ |
| **1 - 5** | Backdoor, DoS, Reconnaissance, Benign | $10^3 - 10^4$ |
| **5 - 10** | DoS, Fuzzers, Benign | $10^2 - 10^3$ |
| **10 - 15** | Benign, Fuzzers | $10^1 - 10^3$ |
| **15 - 25** | Fuzzers, Benign | $10^0 - 10^1$ |
| **25 - 60** | None | 0 |