## Chart: Loss Increase vs. Architecture Parameters
### Overview
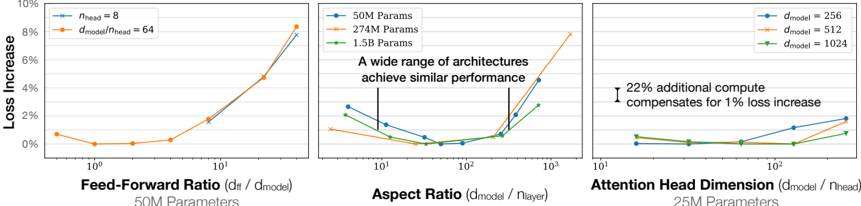
The image presents three line charts comparing the "Loss Increase" (y-axis) against different architectural parameters (x-axis) for neural networks. The charts explore the impact of "Feed-Forward Ratio", "Aspect Ratio", and "Attention Head Dimension" on model performance, measured by loss increase. Each chart uses different parameter settings (50M, 274M, 1.5B) or model dimensions (256, 512, 1024) as separate data series.
### Components/Axes
**General:**
* **Y-axis:** "Loss Increase" ranging from 0% to 10%.
* **X-axis:** Logarithmic scale (base 10) for all three charts.
**Chart 1: Feed-Forward Ratio**
* **X-axis:** "Feed-Forward Ratio (dff / dmodel)".
* X-axis markers: 10<sup>0</sup>, 10<sup>1</sup>
* **Parameter Setting:** 50M Parameters
* **Legend:** Located in the top-left corner of the entire image.
* Blue line: n<sub>head</sub> = 8
* Orange line: d<sub>model</sub> / n<sub>head</sub> = 64
**Chart 2: Aspect Ratio**
* **X-axis:** "Aspect Ratio (dmodel / nlayer)".
* X-axis markers: 10<sup>1</sup>, 10<sup>2</sup>, 10<sup>3</sup>
* **Parameter Settings:**
* Blue line: 50M Params
* Orange line: 274M Params
* Green line: 1.5B Params
* **Text Overlay:** "A wide range of architectures achieve similar performance" with vertical lines indicating the range.
**Chart 3: Attention Head Dimension**
* **X-axis:** "Attention Head Dimension (dmodel / nhead)".
* X-axis markers: 10<sup>1</sup>, 10<sup>2</sup>
* **Parameter Settings:** 25M Parameters
* **Legend:** Located in the top-right corner of the entire image.
* Blue line: d<sub>model</sub> = 256
* Orange line: d<sub>model</sub> = 512
* Green line: d<sub>model</sub> = 1024
* **Text Overlay:** "22% additional compute compensates for 1% loss increase" with a vertical line and arrow indicating the loss increase.
### Detailed Analysis
**Chart 1: Feed-Forward Ratio (50M Parameters)**
* **Blue Line (nhead = 8):** Starts at approximately 0.5% loss increase at x=10<sup>0</sup>, remains relatively flat until x=10<sup>1</sup>, then increases to approximately 2% at x=10<sup>1</sup>.
* **Orange Line (dmodel / nhead = 64):** Starts at approximately 0.7% loss increase at x=10<sup>0</sup>, decreases slightly to approximately 0% at x=10<sup>0.5</sup>, then increases sharply to approximately 8% at x=10<sup>1</sup>.
**Chart 2: Aspect Ratio**
* **Blue Line (50M Params):** Starts at approximately 2.5% loss increase at x=10<sup>1</sup>, decreases to approximately 0.2% at x=10<sup>2</sup>, then increases to approximately 2% at x=10<sup>3</sup>.
* **Orange Line (274M Params):** Starts at approximately 1% loss increase at x=10<sup>1</sup>, decreases to approximately 0% at x=10<sup>2</sup>, then increases to approximately 8% at x=10<sup>3</sup>.
* **Green Line (1.5B Params):** Starts at approximately 2% loss increase at x=10<sup>1</sup>, decreases to approximately 0.1% at x=10<sup>2</sup>, then increases to approximately 3% at x=10<sup>3</sup>.
**Chart 3: Attention Head Dimension (25M Parameters)**
* **Blue Line (dmodel = 256):** Starts at approximately 0.2% loss increase at x=10<sup>1</sup>, remains relatively flat until x=10<sup>2</sup>, then increases to approximately 1.5% at x=10<sup>2</sup>.
* **Orange Line (dmodel = 512):** Starts at approximately 0.1% loss increase at x=10<sup>1</sup>, remains relatively flat until x=10<sup>2</sup>, then increases to approximately 1% at x=10<sup>2</sup>.
* **Green Line (dmodel = 1024):** Starts at approximately 0.1% loss increase at x=10<sup>1</sup>, remains relatively flat until x=10<sup>2</sup>, then increases to approximately 0.5% at x=10<sup>2</sup>.
### Key Observations
* **Feed-Forward Ratio:** Increasing the feed-forward ratio significantly increases the loss, especially when dmodel / nhead = 64.
* **Aspect Ratio:** There's a performance sweet spot around an aspect ratio of 100 (10<sup>2</sup>), where the loss is minimized across different parameter settings.
* **Attention Head Dimension:** Increasing the attention head dimension generally leads to a slight increase in loss.
* **Parameter Settings:** The 274M parameter setting shows the most significant increase in loss with increasing aspect ratio.
### Interpretation
The charts suggest that the architecture of a neural network significantly impacts its performance, as measured by loss increase. The "Aspect Ratio" chart indicates that there is an optimal ratio for minimizing loss, and deviating from this ratio increases the loss. The "Feed-Forward Ratio" chart shows that increasing the feed-forward ratio can lead to a substantial increase in loss. The "Attention Head Dimension" chart suggests that increasing the attention head dimension has a less pronounced effect on loss compared to the other two parameters. The text overlays highlight that a wide range of architectures can achieve similar performance and that additional compute can compensate for loss increases. These findings can guide the design of more efficient and effective neural network architectures.