TECHNICAL ASSET FINGERPRINT
34209e5367aa1596f85478ee
Click to view fullscreen
Press ESC or click to close
FOUND IN PAPERS
EXPERT: healer-alpha-free VERSION 1
RUNTIME: free/openrouter/healer-alpha
INTEL_VERIFIED
## Multi-Panel Chart: Transformer Architecture Hyperparameter Sensitivity Analysis
### Overview
The image displays three horizontally arranged line charts, each analyzing the impact of a different architectural hyperparameter on model performance (measured as "Loss Increase") for transformer-based neural networks. The charts share a common y-axis ("Loss Increase" in percentage) and use logarithmic x-axes. Each chart isolates a specific parameter while holding others constant, providing a comparative sensitivity analysis.
### Components/Axes
**Common Elements:**
* **Y-Axis (All Charts):** "Loss Increase" with a scale from 0% to 10%, marked at 2% intervals.
* **X-Axis (All Charts):** Logarithmic scale.
* **Chart Titles:** Located below each chart.
* **Parameter Subtitles:** Located below each chart title, indicating the fixed model size for that experiment.
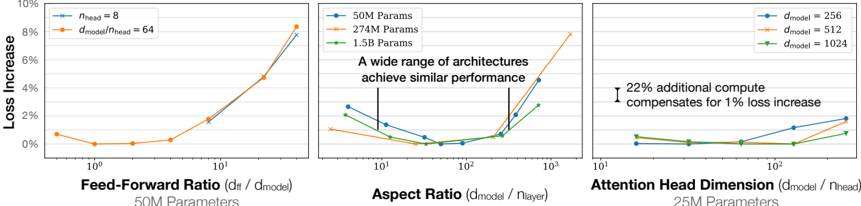
**Chart 1 (Left): Feed-Forward Ratio**
* **Title:** "Feed-Forward Ratio (d_ff / d_model)"
* **Subtitle:** "50M Parameters"
* **X-Axis Label:** Implicit from title. Scale ranges from 10^0 (1) to 10^1 (10).
* **Legend (Top-Left):**
* Blue line with circle markers: `d_model = 8`
* Orange line with diamond markers: `d_ff / d_model = 64`
**Chart 2 (Center): Aspect Ratio**
* **Title:** "Aspect Ratio (d_model / n_layer)"
* **Subtitle:** "A wide range of architectures achieve similar performance"
* **X-Axis Label:** Implicit from title. Scale ranges from 10^1 (10) to 10^3 (1000).
* **Legend (Top-Left):**
* Blue line with circle markers: `50M Params`
* Orange line with diamond markers: `274M Params`
* Green line with square markers: `1.5B Params`
**Chart 3 (Right): Attention Head Dimension**
* **Title:** "Attention Head Dimension (d_model / n_head)"
* **Subtitle:** "25M Parameters"
* **X-Axis Label:** Implicit from title. Scale ranges from 10^1 (10) to 10^2 (100).
* **Legend (Top-Right):**
* Blue line with circle markers: `d_model = 256`
* Orange line with diamond markers: `d_model = 512`
* Green line with square markers: `d_model = 1024`
* **Annotation (Center-Right):** "22% additional compute compensates for 1% loss increase" with a vertical bar indicating the range.
### Detailed Analysis
**Chart 1: Feed-Forward Ratio (50M Parameters)**
* **Trend Verification:** Both lines show a U-shaped curve. Loss is minimal around a ratio of 2-4 and increases sharply as the ratio moves away from this optimum, particularly for higher ratios.
* **Data Points (Approximate):**
* **Blue Line (`d_model=8`):** Starts at ~0.8% loss (ratio=1), dips to ~0.1% (ratio=2), rises to ~0.5% (ratio=4), ~2% (ratio=8), and ~8% (ratio=10).
* **Orange Line (`d_ff/d_model=64`):** Follows a nearly identical path to the blue line, suggesting the trend is consistent across these configurations.
**Chart 2: Aspect Ratio (Various Model Sizes)**
* **Trend Verification:** All three lines show a shallow U-shape or a flat region followed by an increase. Performance is relatively stable across a wide range of aspect ratios (approximately 20 to 200) before degrading at very high ratios.
* **Data Points (Approximate):**
* **Blue Line (50M):** Starts at ~2.5% loss (ratio=10), decreases to ~0.5% (ratio=50), remains low until ratio=200, then rises to ~5% (ratio=1000).
* **Orange Line (274M):** Starts at ~1.5% (ratio=10), dips to ~0.2% (ratio=100), then increases to ~8% (ratio=1000).
* **Green Line (1.5B):** Starts at ~2% (ratio=10), reaches a minimum of ~0% (ratio=100), and rises to ~3% (ratio=500, data ends).
**Chart 3: Attention Head Dimension (25M Parameters)**
* **Trend Verification:** All lines show a gradual, monotonic increase in loss as the head dimension increases. The slope is gentle.
* **Data Points (Approximate):**
* **Blue Line (`d_model=256`):** Starts at ~0.2% loss (dim=16), increases to ~1.5% (dim=64), and ~2% (dim=128).
* **Orange Line (`d_model=512`):** Starts at ~0.1% (dim=16), increases to ~1% (dim=64), and ~1.8% (dim=128).
* **Green Line (`d_model=1024`):** Starts at ~0% (dim=16), increases to ~0.8% (dim=64), and ~1.2% (dim=128).
* **Annotation:** The text "22% additional compute compensates for 1% loss increase" is positioned near the right side of the chart, suggesting a trade-off between computational cost and performance within the explored range.
### Key Observations
1. **Optimal Ranges:** Each hyperparameter has an optimal range where loss is minimized. For Feed-Forward Ratio, it's ~2-4. For Aspect Ratio, it's a broad plateau between ~20-200. For Attention Head Dimension, smaller values (within the tested range) yield lower loss.
2. **Sensitivity:** Loss increases more dramatically for deviations from the optimum in the Feed-Forward Ratio chart compared to the more gradual slopes in the Attention Head Dimension chart.
3. **Scale Invariance:** The trends in the Aspect Ratio chart are qualitatively similar across model sizes (50M to 1.5B parameters), indicating the finding is robust to scale.
4. **Performance Floor:** The minimum achievable loss (the bottom of the U-curves) appears to be close to 0% increase relative to the baseline in these controlled experiments.
### Interpretation
This set of charts provides a technical guide for tuning transformer architecture. It demonstrates that model performance is sensitive to the balance between width (d_model), depth (n_layer), and internal dimensions (d_ff, n_head).
* **Feed-Forward Ratio:** The sharp U-curve indicates a "Goldilocks zone." Too small a feed-forward layer limits capacity, while too large a layer may lead to optimization difficulties or overfitting, increasing loss.
* **Aspect Ratio:** The wide, flat optimal region is a key finding. It suggests practitioners have significant flexibility in choosing between wider or deeper models for a given parameter count without sacrificing performance, until the ratio becomes extreme.
* **Attention Head Dimension:** The gentle upward trend suggests that, for a fixed small model (25M params), increasing the dimension per attention head (which reduces the number of heads for a fixed d_model) slightly harms performance. The annotation highlights a direct trade-off: accepting a small loss increase can save significant compute, or vice-versa.
**Underlying Message:** The charts collectively argue for careful, empirical hyperparameter tuning. They show that while there are robust optimal regions (especially for Aspect Ratio), other parameters like Feed-Forward Ratio require precise tuning to avoid significant performance degradation. The data supports designing architectures within the identified stable regions to maximize efficiency and performance.
DECODING INTELLIGENCE...