## Line Charts: Model Architecture Parameters vs. Loss Increase
### Overview
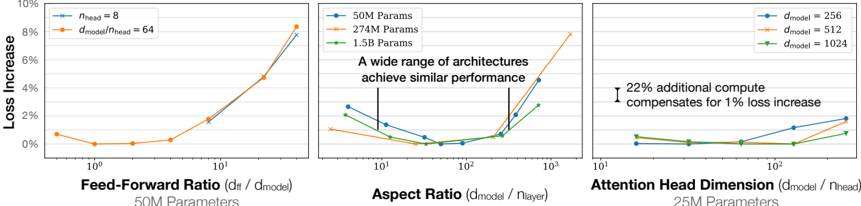
The image contains three line charts comparing different transformer model architecture parameters (feed-forward ratio, aspect ratio, attention head dimension) against loss increase percentages. Each chart explores how scaling specific architectural components affects model performance, with annotations highlighting key insights about computational trade-offs and architectural equivalence.
### Components/Axes
1. **Left Chart**
- **X-axis**: Feed-Forward Ratio (dff / dmodel) [log scale: 10⁰ to 10¹]
- **Y-axis**: Loss Increase (%) [0% to 10%]
- **Legend**: Top-right corner
- Blue line: `nhead = 8`
- Orange line: `dmodel/nhead = 64`
2. **Middle Chart**
- **X-axis**: Aspect Ratio (dmodel / nlayer) [log scale: 10¹ to 10³]
- **Y-axis**: Loss Increase (%) [0% to 10%]
- **Legend**: Top-right corner
- Blue line: `50M Parameters`
- Orange line: `274M Parameters`
- Green line: `1.5B Parameters`
- **Annotation**: "A wide range of architectures achieve similar performance" (highlighted at x=10²)
3. **Right Chart**
- **X-axis**: Attention Head Dimension (dmodel / nhead) [log scale: 10¹ to 10²]
- **Y-axis**: Loss Increase (%) [0% to 10%]
- **Legend**: Top-right corner
- Blue line: `dmodel = 256`
- Orange line: `dmodel = 512`
- Green line: `dmodel = 1024`
- **Annotation**: "22% additional compute compensates for 1% loss increase" (highlighted at x=10¹)
### Detailed Analysis
#### Left Chart: Feed-Forward Ratio vs. Loss Increase
- **Trend**: Both lines show a sharp upward trend as the feed-forward ratio increases.
- **Data Points**:
- Blue (`nhead = 8`): Starts at ~0.5% loss (x=10⁰), peaks at ~8% (x=10¹).
- Orange (`dmodel/nhead = 64`): Starts at ~0.5% loss (x=10⁰), peaks at ~9% (x=10¹).
#### Middle Chart: Aspect Ratio vs. Loss Increase
- **Trend**: All lines exhibit a U-shaped curve, dipping to near 0% loss before rising again.
- **Data Points**:
- Blue (`50M`): Starts at ~2% (x=10¹), dips to ~0% (x=10¹.5), rises to ~4% (x=10²).
- Orange (`274M`): Starts at ~1% (x=10¹), dips to ~0% (x=10¹.5), rises to ~8% (x=10²).
- Green (`1.5B`): Starts at ~3% (x=10¹), dips to ~0% (x=10¹.5), rises to ~3% (x=10²).
#### Right Chart: Attention Head Dimension vs. Loss Increase
- **Trend**: All lines show a gradual increase in loss as the attention head dimension grows.
- **Data Points**:
- Blue (`dmodel = 256`): Starts at ~1% (x=10¹), dips to ~0% (x=10¹.5), rises to ~2% (x=10²).
- Orange (`dmodel = 512`): Starts at ~0.5% (x=10¹), dips to ~0% (x=10¹.5), rises to ~1.5% (x=10²).
- Green (`dmodel = 1024`): Starts at ~0.5% (x=10¹), dips to ~0% (x=10¹.5), rises to ~1% (x=10²).
### Key Observations
1. **Scaling Trade-offs**: Increasing architectural ratios (feed-forward, aspect, attention head) correlates with higher loss, but the relationship is non-linear.
2. **Architectural Equivalence**: The middle chart’s annotation suggests that models of vastly different sizes (50M to 1.5B parameters) can achieve comparable performance at specific aspect ratios.
3. **Compute Compensation**: The right chart’s annotation implies that doubling the model size (e.g., 256 → 512) requires 22% more compute to offset a 1% loss increase.
4. **Optimal Ratios**: All charts show a "valley" in loss at intermediate ratios (e.g., x=10¹.5), suggesting optimal architectural configurations.
### Interpretation
The data demonstrates that transformer model performance is highly sensitive to architectural scaling. While larger models (e.g., 1.5B parameters) may achieve similar loss profiles to smaller ones (50M), they require disproportionate computational resources. The "valley" in loss curves indicates that intermediate parameter ratios (e.g., aspect ratio ~10¹.5) offer the best efficiency. The right chart’s annotation underscores the computational cost of scaling: a 22% increase in compute is needed to mitigate a 1% loss increase when doubling model size. This highlights a critical trade-off between model capacity and efficiency, suggesting that architectural optimization (rather than brute-force scaling) may be more effective for maintaining performance.