\n
## Heatmaps: Jailbreakbench & Malicious Instruct ASR Heatmaps
### Overview
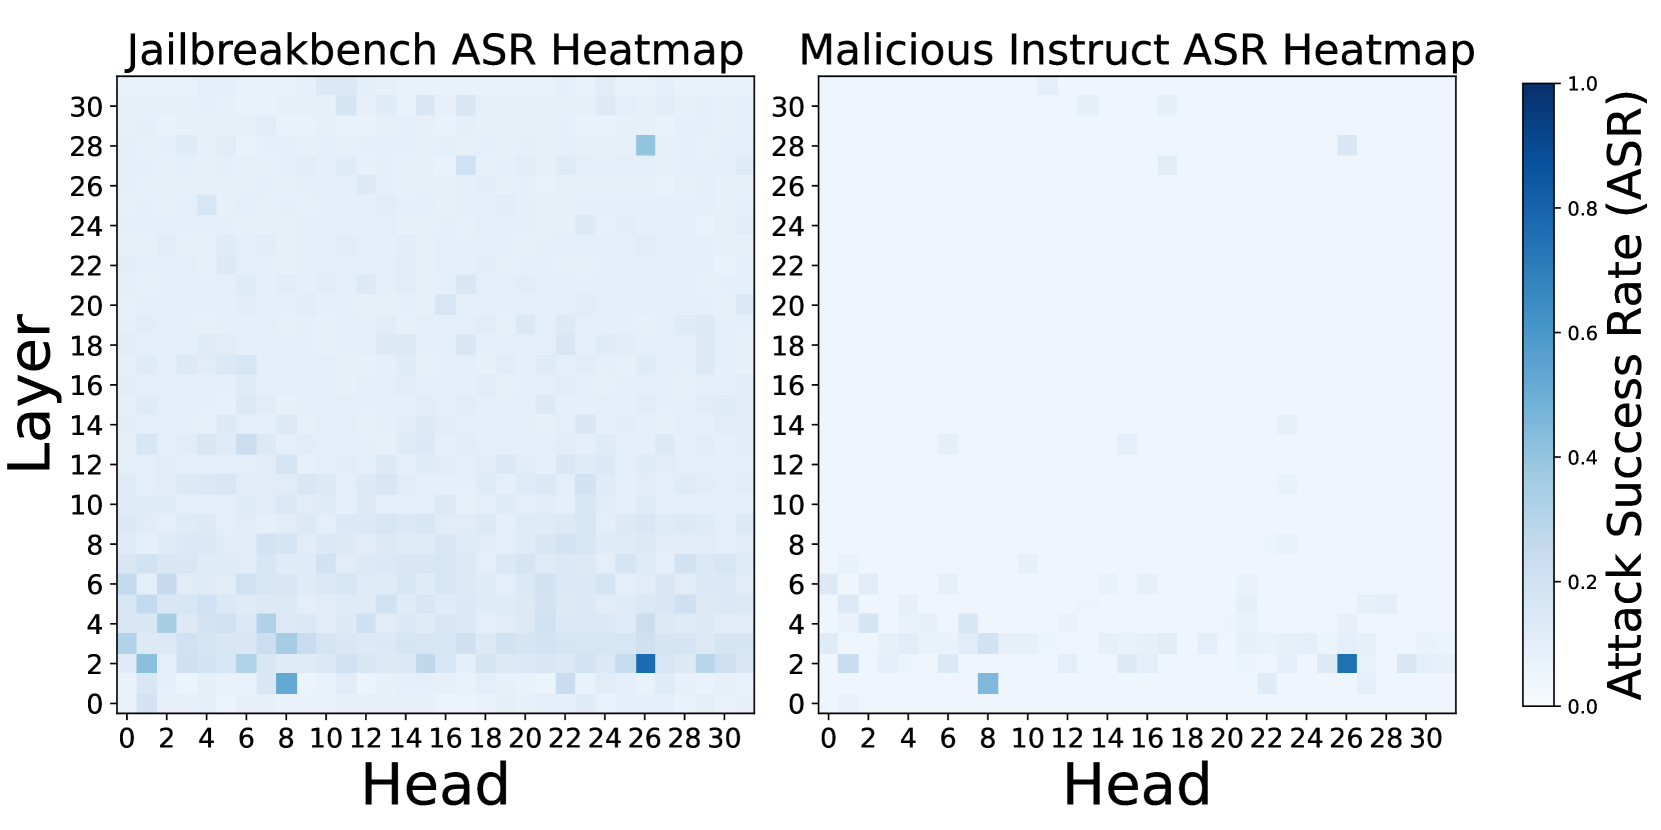
The image presents two heatmaps side-by-side, both visualizing Attack Success Rate (ASR) as a function of Layer and Head. The left heatmap is labeled "Jailbreakbench ASR Heatmap", and the right is labeled "Malicious Instruct ASR Heatmap". Both heatmaps share the same axes scales and colorbar. The heatmaps appear to represent the success rate of attacks on a model, broken down by the layer and head used in the attack.
### Components/Axes
Both heatmaps share the following components:
* **X-axis:** "Head", ranging from 0 to 30, with tick marks at integer values.
* **Y-axis:** "Layer", ranging from 0 to 30, with tick marks at integer values.
* **Colorbar:** Located to the right of the second heatmap, representing "Attack Success Rate (ASR)", ranging from 0.0 to 1.0, with tick marks at 0.0, 0.2, 0.4, 0.6, 0.8, and 1.0. The color gradient transitions from light blue (low ASR) to dark blue (high ASR).
* **Titles:** "Jailbreakbench ASR Heatmap" (left) and "Malicious Instruct ASR Heatmap" (right).
### Detailed Analysis or Content Details
**Jailbreakbench ASR Heatmap (Left)**
The heatmap shows a sparse distribution of higher ASR values. The highest ASR values (approximately 0.6-0.8) are concentrated around:
* Head 22-28, Layer 2-6
* Head 6-8, Layer 2-4
* Head 0-4, Layer 2-3
Most of the heatmap is light blue, indicating very low ASR values (close to 0.0). There is a slight increase in ASR values along the Layer 2-6 range for heads 0-30, but it remains generally low.
**Malicious Instruct ASR Heatmap (Right)**
This heatmap also exhibits a sparse distribution of higher ASR values, but the pattern is different from the Jailbreakbench heatmap. The highest ASR values (approximately 0.1-0.2) are concentrated around:
* Head 26-28, Layer 2-4
* Head 0-4, Layer 2-3
Similar to the Jailbreakbench heatmap, most of the area is light blue, indicating low ASR values. The ASR values are generally lower than those observed in the Jailbreakbench heatmap.
### Key Observations
* **Sparsity:** Both heatmaps show a sparse distribution of high ASR values, suggesting that only specific combinations of layers and heads are vulnerable to attacks.
* **Head Dependence:** ASR appears to be more sensitive to the "Head" value than the "Layer" value, as the higher ASR regions are more localized along the Head axis.
* **Difference between Datasets:** The Jailbreakbench dataset shows significantly higher ASR values overall compared to the Malicious Instruct dataset. The patterns of vulnerability also differ between the two datasets.
* **Low Overall Success Rate:** The overall success rate of attacks appears to be relatively low for both datasets, as most of the heatmap is light blue.
### Interpretation
These heatmaps likely represent the results of an experiment evaluating the robustness of a language model against adversarial attacks. The "Jailbreakbench" dataset appears to be more susceptible to attacks than the "Malicious Instruct" dataset, as evidenced by the higher ASR values. The concentration of high ASR values around specific heads suggests that these heads may be more vulnerable to manipulation or may play a critical role in the model's decision-making process.
The difference in vulnerability between the two datasets could be due to several factors, such as the nature of the attacks used, the training data used to train the model, or the model's architecture. The sparsity of high ASR values suggests that the model is generally robust to attacks, but that there are specific vulnerabilities that can be exploited.
Further investigation is needed to understand the underlying reasons for these vulnerabilities and to develop strategies to mitigate them. This could involve analyzing the behavior of the vulnerable heads, modifying the model's architecture, or using adversarial training techniques. The heatmaps provide a valuable starting point for identifying and addressing potential security risks in language models.