\n
## Heatmap Comparison: Jailbreak Attack Success Rates
### Overview
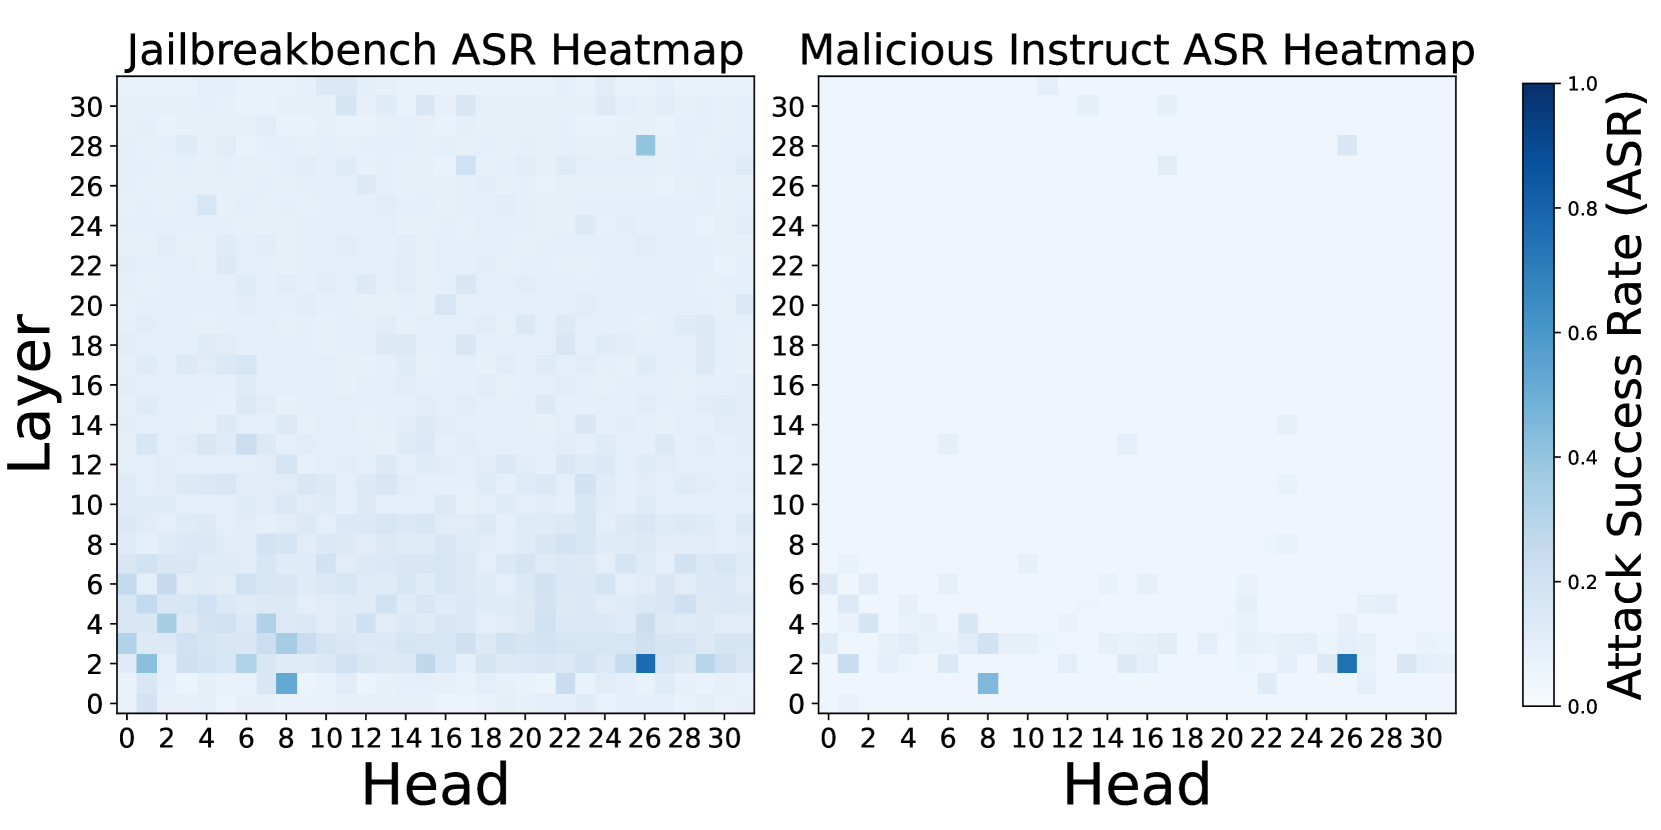
The image displays two side-by-side heatmaps visualizing the Attack Success Rate (ASR) of jailbreak attempts across different attention heads and layers of a neural network model. The left heatmap is titled "Jailbreakbench ASR Heatmap," and the right is titled "Malicious Instruct ASR Heatmap." A shared color bar on the far right provides the scale for interpreting the ASR values.
### Components/Axes
* **Titles:**
* Left Heatmap: "Jailbreakbench ASR Heatmap"
* Right Heatmap: "Malicious Instruct ASR Heatmap"
* **Axes (Identical for both heatmaps):**
* **X-axis (Bottom):** Labeled "Head". The axis is marked with numerical ticks from 0 to 30, incrementing by 2 (0, 2, 4, ..., 30).
* **Y-axis (Left):** Labeled "Layer". The axis is marked with numerical ticks from 0 to 30, incrementing by 2 (0, 2, 4, ..., 30).
* **Legend / Color Bar:**
* **Position:** Located vertically on the far right of the image, spanning the height of both heatmaps.
* **Label:** "Attack Success Rate (ASR)"
* **Scale:** A continuous gradient from light blue (value 0.0) to dark blue (value 1.0). Tick marks are present at 0.0, 0.2, 0.4, 0.6, 0.8, and 1.0.
### Detailed Analysis
**Data Representation:** Each cell in the 31x31 grid (Heads 0-30, Layers 0-30) represents the ASR for a specific attention head at a specific layer. The color intensity indicates the ASR value, with darker blue signifying a higher success rate.
**Jailbreakbench ASR Heatmap (Left):**
* **Trend:** Higher ASR values (darker blue cells) are scattered but show a concentration in the lower layers (approximately Layers 0-6).
* **Key Data Points (Approximate):**
* **Highest ASR (~0.9-1.0):** A very dark blue cell is located at approximately **Head 8, Layer 1**. Another very dark cell is at **Head 26, Layer 2**.
* **High ASR (~0.6-0.8):** Notable cells include **Head 0, Layer 2**; **Head 4, Layer 4**; **Head 6, Layer 4**; **Head 26, Layer 28**.
* **Moderate ASR (~0.3-0.5):** Scattered cells are present, for example, around **Head 10, Layer 12** and **Head 16, Layer 18**.
* The majority of the grid, especially in higher layers (above ~10), shows very low ASR (light blue/white, ~0.0-0.2).
**Malicious Instruct ASR Heatmap (Right):**
* **Trend:** High ASR values are even more sparsely distributed and are almost exclusively confined to the very lowest layers (Layers 0-4).
* **Key Data Points (Approximate):**
* **Highest ASR (~0.9-1.0):** A very dark blue cell is located at approximately **Head 8, Layer 1**. Another very dark cell is at **Head 26, Layer 2**.
* **High ASR (~0.6-0.8):** A few cells are visible, such as **Head 0, Layer 2** and **Head 4, Layer 4**.
* **Moderate/Low ASR:** Very few cells outside the lowest layers show any significant color. The heatmap is predominantly light blue/white, indicating near-zero ASR across most head-layer combinations.
### Key Observations
1. **Consistent Hotspots:** Both benchmarks identify the same two attention heads as highly vulnerable: **Head 8 at Layer 1** and **Head 26 at Layer 2**. These are the most prominent features in both visualizations.
2. **Layer Sensitivity:** Attack success is heavily concentrated in the initial layers of the model (Layers 0-6). ASR drops off dramatically in middle and upper layers.
3. **Benchmark Difference:** The "Jailbreakbench" heatmap shows a broader, more scattered pattern of moderate success across various heads and slightly higher layers compared to the "Malicious Instruct" heatmap, which shows success almost exclusively at the two primary hotspots in the lowest layers.
4. **Overall Low ASR:** Despite the highlighted hotspots, the vast majority of the model's attention heads (the light-colored areas) show very low to zero attack success rate, suggesting most heads are not susceptible to these specific jailbreak methods.
### Interpretation
This visualization provides a diagnostic map of a model's vulnerability to jailbreak attacks. The data suggests that successful attacks do not require manipulating the entire network but can be achieved by targeting specific, localized components—namely, a small number of attention heads in the earliest processing layers.
The concentration in lower layers may indicate that jailbreak prompts succeed by corrupting or bypassing the initial stages of input processing and safety alignment, preventing the model from ever engaging its higher-level reasoning or safety filters. The two consistent hotspots (Head 8/Layer 1 and Head 26/Layer 2) represent critical failure points; understanding why these specific heads are vulnerable could be key to developing more robust defenses.
The difference between the two heatmaps implies that the "Jailbreakbench" suite may contain a more diverse set of attack vectors that can exploit a wider range of model components, whereas the "Malicious Instruct" set appears to rely on a more specific, narrow vulnerability. This kind of analysis is crucial for red-teaming AI systems, as it moves beyond a simple "pass/fail" metric to provide actionable insights into *where* and *how* safety measures can be circumvented.