## Bar Chart: Accuracy Comparison of GPT-3, GPT-4, and Humans on Analogy Tasks
### Overview
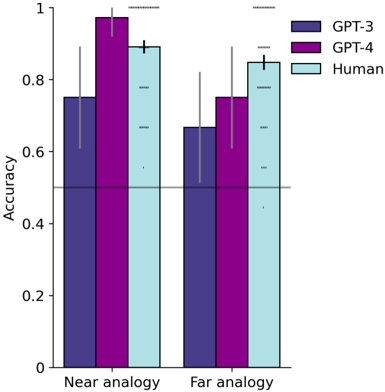
The image is a bar chart comparing the accuracy of GPT-3, GPT-4, and humans on near and far analogy tasks. The chart displays accuracy on the y-axis and the type of analogy (near or far) on the x-axis. Error bars are included to indicate variability.
### Components/Axes
* **Y-axis:** "Accuracy", ranging from 0 to 1 in increments of 0.2.
* **X-axis:** Categorical, with two categories: "Near analogy" and "Far analogy".
* **Legend:** Located in the top-right corner, indicating the color-coding for each group:
* Dark Blue: GPT-3
* Purple: GPT-4
* Light Blue: Human
* A horizontal line is present at y = 0.5.
### Detailed Analysis
**Near Analogy:**
* **GPT-3 (Dark Blue):** Accuracy is approximately 0.75, with an error bar extending from roughly 0.6 to 0.9.
* **GPT-4 (Purple):** Accuracy is approximately 0.97, with an error bar extending from roughly 0.9 to 1.0.
* **Human (Light Blue):** Accuracy is approximately 0.9, with an error bar extending from roughly 0.8 to 0.95.
**Far Analogy:**
* **GPT-3 (Dark Blue):** Accuracy is approximately 0.67, with an error bar extending from roughly 0.5 to 0.8.
* **GPT-4 (Purple):** Accuracy is approximately 0.75, with an error bar extending from roughly 0.6 to 0.9.
* **Human (Light Blue):** Accuracy is approximately 0.85, with an error bar extending from roughly 0.75 to 0.9.
### Key Observations
* GPT-4 consistently outperforms GPT-3 in both near and far analogy tasks.
* Humans generally achieve higher accuracy than both GPT-3 and GPT-4.
* The accuracy for all groups is higher in near analogy tasks compared to far analogy tasks.
* The error bars suggest more variability in the performance of GPT-3 and GPT-4 compared to humans, especially in far analogy tasks.
### Interpretation
The data suggests that while GPT-4 represents an improvement over GPT-3 in analogy tasks, it still falls short of human performance. The difference in accuracy between near and far analogy tasks indicates that the difficulty of the task significantly impacts the performance of both AI models and humans. The error bars highlight the consistency of human performance compared to the AI models, which may be due to the models' sensitivity to specific prompts or variations in the data. The horizontal line at 0.5 (50% accuracy) serves as a baseline, indicating performance better than random chance.