## Diagram: Optical Geometry and Levels
### Overview
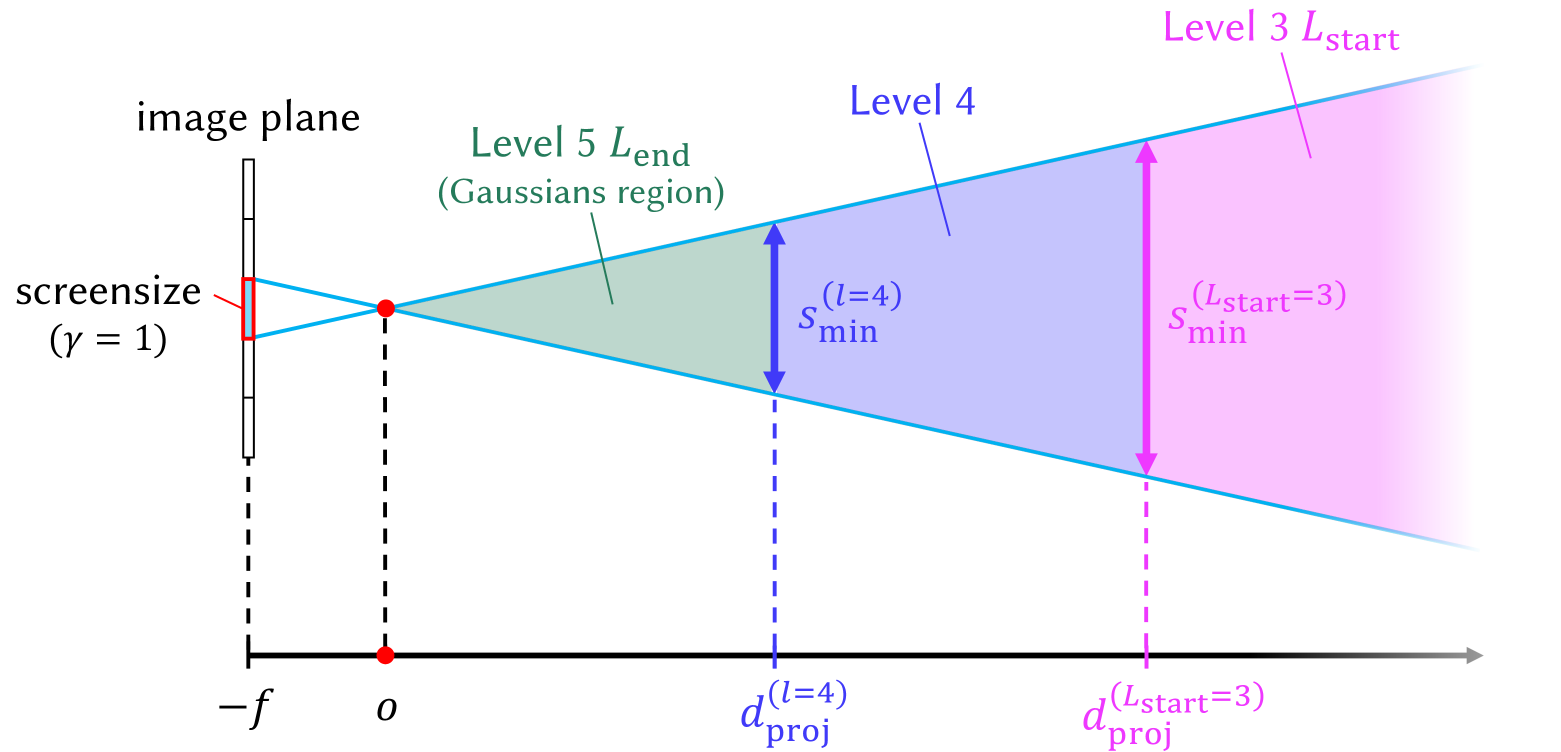
The image is a diagram illustrating the optical geometry of a system, showing the relationship between an image plane, screensize, and different levels (Level 3, Level 4, Level 5). It depicts how the size of a region changes with distance from the image plane.
### Components/Axes
* **Image Plane:** Located on the left side of the diagram.
* **Screensize:** Represented by a red rectangle on the image plane, labeled with "(γ = 1)".
* **Origin:** Point labeled "o" on the horizontal axis.
* **Horizontal Axis:** Represents distance, with "-f" marking a point to the left of the origin. An arrow indicates the positive direction.
* **Level 5 Lend (Gaussians region):** A green triangular region originating from a point between the image plane and the origin.
* **Level 4:** A blue region extending from the end of Level 5.
* **Level 3 Lstart:** A pink region extending from the end of Level 4.
* **Smin:** Vertical distances representing the minimum size at different levels.
* **(l=4) Smin:** Blue arrow indicating the minimum size at Level 4.
* **(Lstart=3) Smin:** Pink arrow indicating the minimum size at Level 3.
* **dproj:** Horizontal distances representing the projection distance at different levels.
* **d(l=4) proj:** Blue label indicating the projection distance for Level 4.
* **d(Lstart=3) proj:** Pink label indicating the projection distance for Level 3.
### Detailed Analysis
* The diagram shows three levels: Level 3, Level 4, and Level 5.
* Level 5 (green) is labeled as the "Gaussians region".
* The screensize is located at "-f" on the horizontal axis.
* The regions expand as the distance from the image plane increases.
* The distances d(l=4)proj and d(Lstart=3)proj are the horizontal distances from the origin to the base of the Smin arrows for Level 4 and Level 3, respectively.
* The Smin arrows indicate the vertical size of the regions at the corresponding dproj locations.
### Key Observations
* The size of the region increases as the level decreases (from Level 5 to Level 3).
* The projection distance (dproj) also increases as the level decreases.
* The diagram illustrates a diverging beam or region expanding from a point.
### Interpretation
The diagram represents a simplified optical system where the size of a region (e.g., a beam or a feature) expands as it propagates away from the image plane. The different levels (3, 4, and 5) likely represent different stages or resolutions in a multi-scale analysis. The "Gaussians region" suggests that Level 5 might be related to a Gaussian approximation or representation of the feature. The diagram is useful for understanding how the size and position of features change with distance in the optical system.