## Technical Diagram: Imaging System Level Structure
### Overview
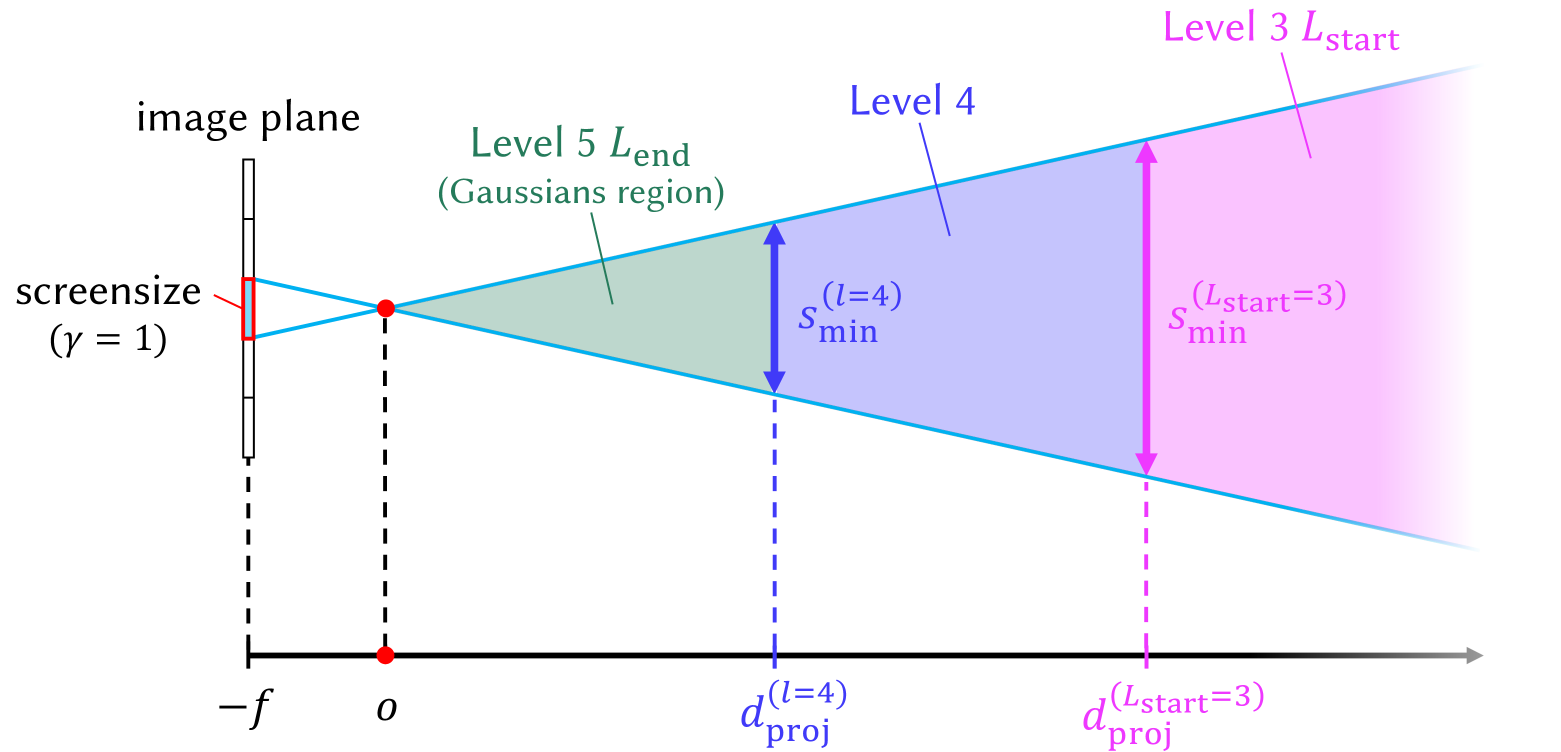
The diagram illustrates a multi-level imaging system architecture with spatial regions defined by projection distances and Gaussian distributions. It shows three hierarchical levels (3, 4, 5) with associated minimum sampling requirements (S_min) and projection distances (d_proj). The system includes an image plane, screen size reference, and a Gaussian region marked as Level 5.
### Components/Axes
1. **Axes**:
- Vertical axis: "image plane" with "screensize (γ = 1)" marked by a red vertical segment
- Horizontal axis: Spatial dimension with points labeled:
- -f (focal point)
- o (object position)
- d_proj^(l=4) (Level 4 projection distance)
- d_proj^(L_start=3) (Level 3 start projection distance)
2. **Regions**:
- Green shaded area: "Level 5 L_end (Gaussians region)"
- Blue shaded area: "Level 4"
- Pink shaded area: "Level 3 L_start"
3. **Legend**:
- Right-side color coding:
- Green: Level 5 (Gaussians region)
- Blue: Level 4
- Pink: Level 3
4. **Key Markers**:
- S_min^(l=4) (blue arrow) and S_min^(L_start=3) (pink arrow)
- Dashed vertical lines at projection distances
- Red vertical segment marking screen size (γ=1)
### Detailed Analysis
- **Spatial Relationships**:
- Level 5 (green) occupies the shortest projection distance range (o to d_proj^(l=4))
- Level 4 (blue) spans the middle range (d_proj^(l=4) to d_proj^(L_start=3))
- Level 3 (pink) covers the longest projection distance (beyond d_proj^(L_start=3))
- **Sampling Requirements**:
- S_min values decrease from Level 5 to Level 3
- Level 5 has the highest S_min requirement
- Level 3 has the lowest S_min requirement
- **Projection Distances**:
- d_proj^(l=4) = 4λ (wavelength units)
- d_proj^(L_start=3) = 3λ (wavelength units)
- Screen size (γ=1) corresponds to the reference focal length
### Key Observations
1. Hierarchical structure with decreasing complexity from Level 5 to Level 3
2. Gaussian region (Level 5) has the tightest spatial constraints
3. Sampling requirements inversely correlate with projection distance
4. Color coding follows a gradient from warm (green) to cool (pink) colors
### Interpretation
This diagram represents an optical imaging system with multi-resolution capabilities:
- **Level 5 (Gaussians region)**: Likely handles high-frequency components with strict sampling requirements (S_min) and short projection distances. The Gaussian distribution suggests noise reduction or signal smoothing applications.
- **Level 4**: Intermediate resolution with moderate sampling needs, positioned between the Gaussian region and Level 3.
- **Level 3**: Coarsest resolution with minimal sampling requirements, operating at the longest projection distance.
The system appears optimized for progressive image reconstruction, with each level contributing different spatial frequencies. The decreasing S_min values suggest a trade-off between resolution and computational complexity, where higher levels (closer to the image plane) require more precise sampling but capture finer details. The Gaussian region's placement at Level 5 indicates its role in foundational image processing before higher-level feature extraction.