## Diagram: Computational Graph with Cookie Analogy
### Overview
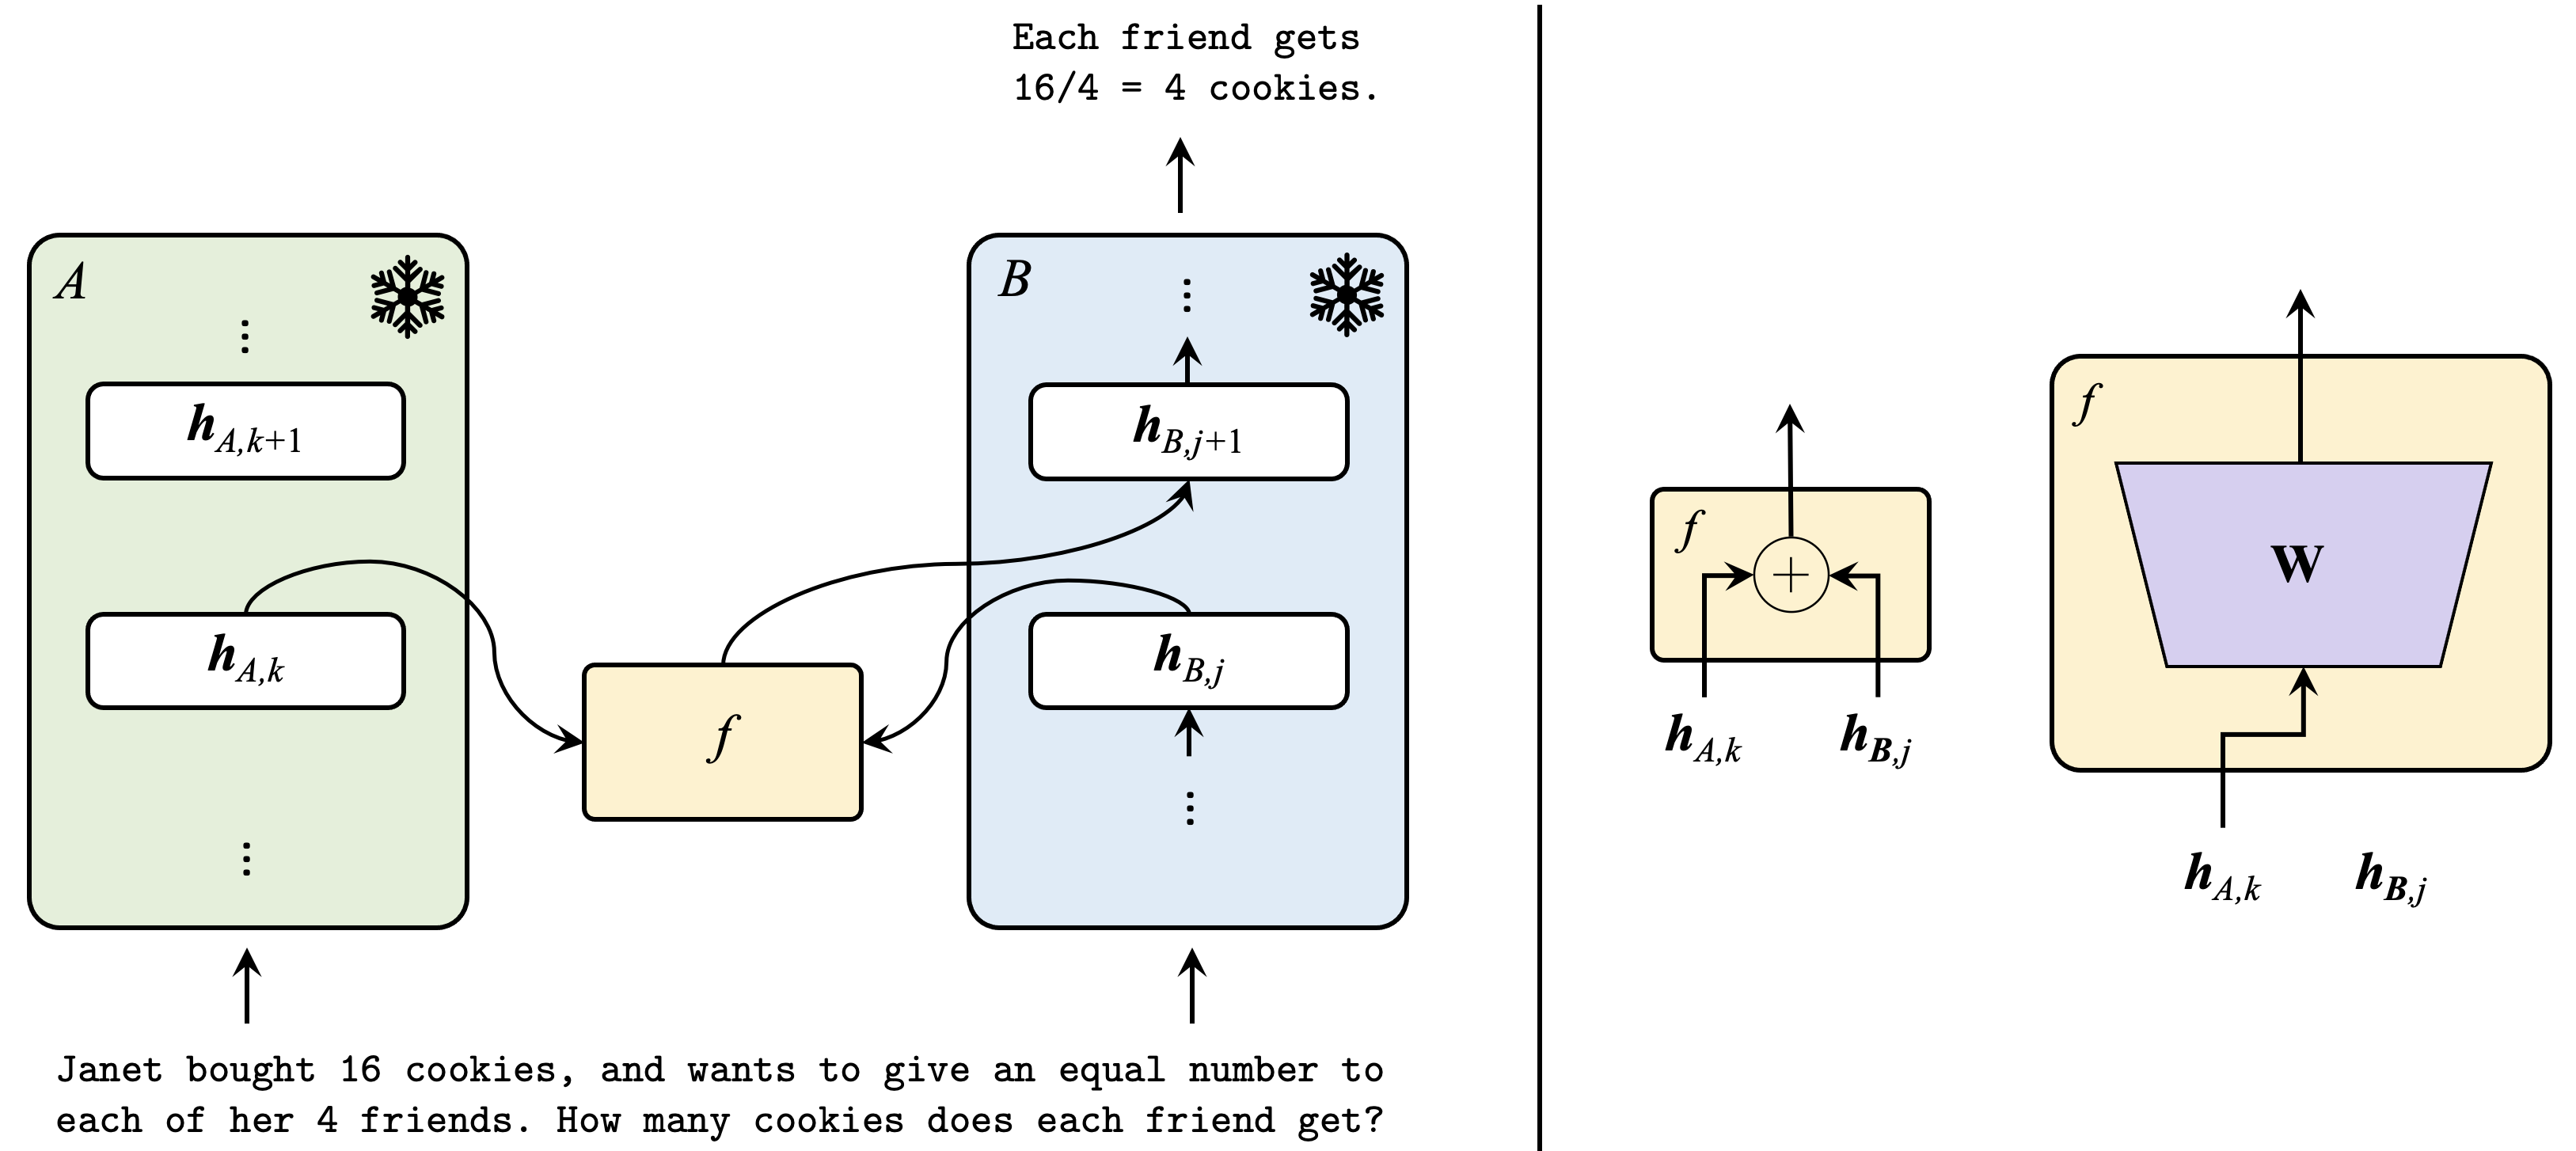
The image presents a computational graph, visually explaining a simple division problem (16 cookies / 4 friends = 4 cookies per friend) using a network-like diagram. The diagram is split into two main sections, with the left side showing a simplified computational flow and the right side showing more detailed representations of the computation.
### Components/Axes
* **Text:**
* "Each friend gets 16/4 = 4 cookies." (Top center)
* "Janet bought 16 cookies, and wants to give an equal number to each of her 4 friends. How many cookies does each friend get?" (Bottom left)
* **Nodes:**
* Node A (Light Green): Contains h\_A,k+1 and h\_A,k, with upward and downward arrows indicating flow.
* Node B (Light Blue): Contains h\_B,j+1 and h\_B,j, with upward and downward arrows indicating flow.
* Node f (Light Yellow): Represents a function or operation.
* **Connections:** Arrows indicate the flow of information between nodes.
* **Symbols:** Snowflake-like symbols are present at the top-right of nodes A and B.
* **Right Side Diagrams:** Two diagrams showing different representations of the function 'f'. The left diagram shows 'f' as a summation of h\_A,k and h\_B,j. The right diagram shows 'f' as a transformation using a weight matrix 'W'.
### Detailed Analysis
* **Left Side Computational Flow:**
* Node A (light green) contains two blocks labeled h\_A,k+1 and h\_A,k.
* Node B (light blue) contains two blocks labeled h\_B,j+1 and h\_B,j.
* An arrow flows from h\_A,k to the yellow node 'f'.
* An arrow flows from 'f' to h\_B,j.
* An arrow flows from 'f' back to h\_A,k+1.
* An arrow flows from h\_B,j to h\_B,j+1.
* **Right Side Diagrams:**
* **Diagram 1 (Left):** A light yellow box labeled 'f' contains a summation symbol (+). Arrows flow from h\_A,k and h\_B,j into the summation, and an arrow flows out of the box.
* **Diagram 2 (Right):** A light yellow box labeled 'f' contains a purple trapezoid labeled 'W'. Arrows flow from h\_A,k and h\_B,j into the trapezoid, and an arrow flows out of the box.
### Key Observations
* The diagram uses a cookie-sharing problem as an analogy to illustrate a computational process.
* The left side shows a high-level flow, while the right side provides more detailed views of the function 'f'.
* The function 'f' is represented in two ways: as a summation and as a weighted transformation.
### Interpretation
The diagram illustrates a computational process, possibly related to a recurrent neural network or similar model. The cookie analogy serves as a simple, relatable example to explain the flow of information and the role of the function 'f'. The two representations of 'f' on the right side suggest that it could be a linear transformation followed by an addition, which is a common operation in neural networks. The diagram highlights the iterative nature of the computation, with information flowing back from 'f' to Node A. The snowflake symbols at the top-right of nodes A and B are not explained, but may represent a specific type of operation or data associated with those nodes.