# Technical Document Extraction: Line Chart Analysis
## 1. Chart Type and Overview
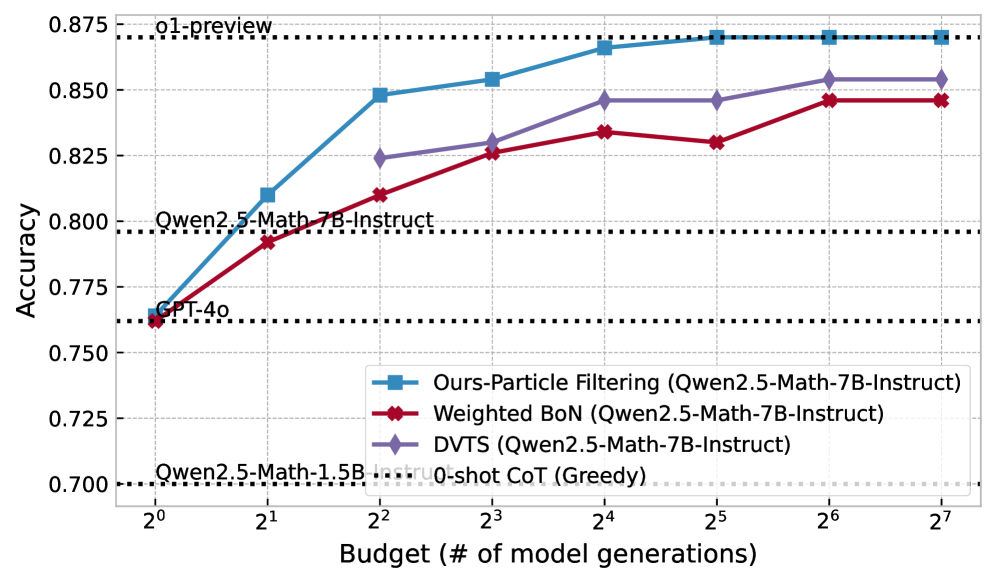
This image is a **line chart** comparing the accuracy of different model configurations against computational budget (number of model generations). The chart includes four data series with distinct visual identifiers.
---
## 2. Axis Labels and Scales
- **X-axis**:
- Title: `Budget (# of model generations)`
- Scale: Logarithmic, powers of 2 from `2⁰` to `2⁷`
- Tick labels: `2⁰`, `2¹`, `2²`, ..., `2⁷`
- **Y-axis**:
- Title: `Accuracy`
- Scale: Linear, from `0.700` to `0.875` in increments of `0.025`
- Tick labels: `0.700`, `0.725`, `0.750`, ..., `0.875`
- **Dashed Reference Lines**:
- `0.875` (dotted black): Labeled `o1-preview`
- `0.700` (dotted black): Labeled `Owen2.5-Math-1.5B-Instruct`
---
## 3. Legend and Data Series
**Legend Location**: Bottom-right corner
**Color-Coded Series**:
1. **Blue (■)**: `Ours-Particle Filtering (Qwen2.5-Math-7B-Instruct)`
2. **Red (◆)**: `Weighted BoN (Qwen2.5-Math-7B-Instruct)`
3. **Purple (◇)**: `DVTS (Qwen2.5-Math-7B-Instruct)`
4. **Gray (dashed)**: `0-shot CoT (Greedy)`
---
## 4. Key Trends and Data Points
### Series 1: `Ours-Particle Filtering` (Blue ■)
- **Trend**: Steadily increasing from `2⁰` to `2⁷`
- **Data Points**:
- `2⁰`: ~0.765
- `2¹`: ~0.810
- `2²`: ~0.850
- `2³`: ~0.855
- `2⁴`: ~0.865
- `2⁵`–`2⁷`: Plateaus at ~0.875
### Series 2: `Weighted BoN` (Red ◆)
- **Trend**: Gradual upward slope with minor fluctuations
- **Data Points**:
- `2⁰`: ~0.760
- `2¹`: ~0.790
- `2²`: ~0.815
- `2³`: ~0.830
- `2⁴`: ~0.835
- `2⁵`: ~0.830
- `2⁶`–`2⁷`: Rises to ~0.850
### Series 3: `DVTS` (Purple ◇)
- **Trend**: Consistent upward trajectory
- **Data Points**:
- `2⁰`: ~0.760
- `2¹`: ~0.810
- `2²`: ~0.825
- `2³`: ~0.830
- `2⁴`: ~0.845
- `2⁵`: ~0.845
- `2⁶`–`2⁷`: Rises to ~0.855
### Series 4: `0-shot CoT (Greedy)` (Gray dashed)
- **Trend**: Flat line at baseline
- **Data Points**:
- All x-values: Fixed at `0.700`
---
## 5. Spatial Grounding and Validation
- **Legend Validation**:
- Blue squares (■) match `Ours-Particle Filtering`
- Red diamonds (◆) match `Weighted BoN`
- Purple diamonds (◇) match `DVTS`
- Gray dashed line matches `0-shot CoT`
- **Color Consistency**:
- All data points align with legend colors (e.g., blue squares at `2⁵` correspond to `Ours-Particle Filtering`).
---
## 6. Component Isolation
- **Header**: No explicit title; context inferred from axes and legend.
- **Main Chart**: Four data series with logarithmic x-axis and linear y-axis.
- **Footer**: No visible text; focus on chart elements.
---
## 7. Additional Observations
- **Performance Benchmarks**:
- `Ours-Particle Filtering` achieves the highest accuracy (~0.875), surpassing `o1-preview`.
- `0-shot CoT (Greedy)` remains the lowest-performing method.
- **Efficiency**: All methods except `0-shot CoT` show improved accuracy with increased budget.
---
## 8. Missing or Ambiguous Elements
- No explicit chart title or source attribution.
- No units for accuracy (assumed unitless, e.g., percentage).
---
## 9. Transcribed Text (English)
- Axis labels: `Budget (# of model generations)`, `Accuracy`
- Legend entries:
- `Ours-Particle Filtering (Qwen2.5-Math-7B-Instruct)`
- `Weighted BoN (Qwen2.5-Math-7B-Instruct)`
- `DVTS (Qwen2.5-Math-7B-Instruct)`
- `0-shot CoT (Greedy)`
- Dashed line labels: `o1-preview`, `Owen2.5-Math-1.5B-Instruct`
---
## 10. Conclusion
The chart demonstrates that `Ours-Particle Filtering` outperforms other methods in accuracy across all budgets, while `0-shot CoT (Greedy)` remains the least effective. All methods except `0-shot CoT` show scalability with increased computational resources.