# Technical Document Extraction: Model Accuracy vs. Generation Budget
## 1. Image Overview
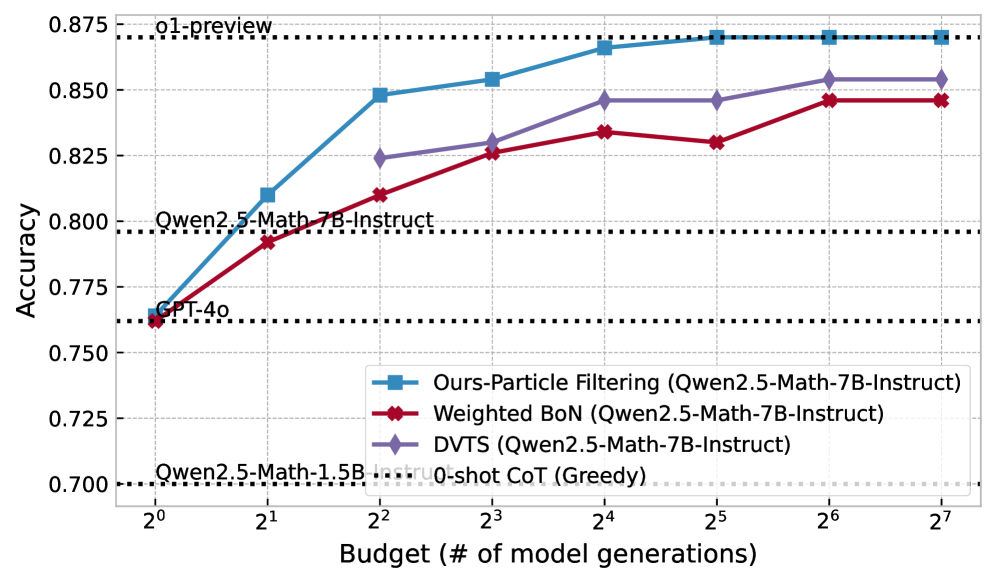
This image is a line graph comparing the performance (Accuracy) of different inference strategies for Large Language Models (LLMs) against a computational budget (number of model generations). The chart uses a logarithmic scale for the x-axis and includes several horizontal reference lines for baseline models.
## 2. Component Isolation
### A. Header / Reference Baselines
The top of the chart contains horizontal black dotted lines representing fixed performance benchmarks.
* **o1-preview**: Positioned at approximately **0.870** accuracy.
* **Qwen2.5-Math-7B-Instruct**: Positioned at approximately **0.796** accuracy.
* **GPT-4o**: Positioned at approximately **0.762** accuracy.
* **Qwen2.5-Math-1.5B-Instruct**: Positioned at approximately **0.700** accuracy.
### B. Main Chart Area (Data Series)
The chart plots four primary data series against a budget ranging from $2^0$ to $2^7$.
**Axis Labels:**
* **Y-Axis**: "Accuracy" (Range: 0.700 to 0.875, increments of 0.025).
* **X-Axis**: "Budget (# of model generations)" (Logarithmic scale: $2^0, 2^1, 2^2, 2^3, 2^4, 2^5, 2^6, 2^7$).
**Legend:**
1. **Blue line with square markers (■)**: `Ours-Particle Filtering (Qwen2.5-Math-7B-Instruct)`
2. **Red line with diamond markers (◆)**: `Weighted BoN (Qwen2.5-Math-7B-Instruct)`
3. **Purple line with diamond markers (◆)**: `DVTS (Qwen2.5-Math-7B-Instruct)`
4. **Black dotted line (---)**: `0-shot CoT (Greedy)` (Note: This serves as the baseline for the 7B model).
---
## 3. Trend Verification and Data Extraction
### Series 1: Ours-Particle Filtering (Blue, Square Markers)
* **Trend**: Steep upward slope from $2^0$ to $2^4$, then plateaus/saturates as it reaches the `o1-preview` baseline at $2^5$. This is the highest-performing method shown.
* **Data Points (Approximate):**
* $2^0$: 0.765
* $2^1$: 0.810
* $2^2$: 0.848
* $2^3$: 0.854
* $2^4$: 0.866
* $2^5$: 0.870 (Matches `o1-preview`)
* $2^6$: 0.870
* $2^7$: 0.870
### Series 2: DVTS (Purple, Diamond Markers)
* **Trend**: Steady upward slope, consistently performing between the Particle Filtering and Weighted BoN methods. It shows a significant jump between $2^1$ and $2^2$.
* **Data Points (Approximate):**
* $2^0$: 0.762 (Starts at GPT-4o level)
* $2^1$: 0.792
* $2^2$: 0.824
* $2^3$: 0.830
* $2^4$: 0.846
* $2^5$: 0.846
* $2^6$: 0.854
* $2^7$: 0.854
### Series 3: Weighted BoN (Red, Diamond Markers)
* **Trend**: Upward slope but with lower efficiency than the other two methods. It shows a slight dip/stagnation at $2^5$ before rising again at $2^6$.
* **Data Points (Approximate):**
* $2^0$: 0.762
* $2^1$: 0.792
* $2^2$: 0.810
* $2^3$: 0.826
* $2^4$: 0.834
* $2^5$: 0.830 (Slight decrease)
* $2^6$: 0.846
* $2^7$: 0.846
---
## 4. Summary Table of Extracted Data
| Budget ($2^n$) | Ours-Particle Filtering | DVTS | Weighted BoN |
| :--- | :--- | :--- | :--- |
| **$2^0$ (1)** | 0.765 | 0.762 | 0.762 |
| **$2^1$ (2)** | 0.810 | 0.792 | 0.792 |
| **$2^2$ (4)** | 0.848 | 0.824 | 0.810 |
| **$2^3$ (8)** | 0.854 | 0.830 | 0.826 |
| **$2^4$ (16)** | 0.866 | 0.846 | 0.834 |
| **$2^5$ (32)** | 0.870 | 0.846 | 0.830 |
| **$2^6$ (64)** | 0.870 | 0.854 | 0.846 |
| **$2^7$ (128)** | 0.870 | 0.854 | 0.846 |
## 5. Key Observations
* **Efficiency**: The "Ours-Particle Filtering" method reaches the performance level of `o1-preview` (the highest baseline) with a budget of $2^5$ (32 generations).
* **Baseline Comparison**: All three tested methods (Particle Filtering, DVTS, Weighted BoN) using the Qwen2.5-Math-7B-Instruct model eventually exceed the performance of GPT-4o and the base 7B-Instruct model's greedy decoding.
* **Saturation**: All methods appear to reach a performance plateau between $2^6$ and $2^7$ generations.