## Chart: Confidence vs. Target Length in College Mathematics
### Overview
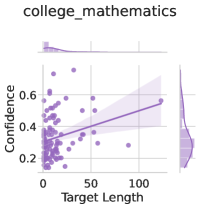
The image is a scatter plot showing the relationship between "Confidence" and "Target Length" in the context of college mathematics. The plot includes marginal distributions (histograms/density plots) for each variable along the axes. A regression line with a confidence interval is overlaid on the scatter plot.
### Components/Axes
* **Title:** college\_mathematics
* **X-axis:** Target Length
* Scale: 0 to 100, with tick marks at approximately 0, 50, and 100.
* **Y-axis:** Confidence
* Scale: 0.2 to 0.6, with tick marks at approximately 0.2, 0.4, and 0.6.
* **Marginal Distributions:**
* Top: Density plot of Target Length.
* Right: Density plot of Confidence.
* **Regression Line:** A light purple line with a shaded confidence interval.
### Detailed Analysis
* **Scatter Plot:** The scatter plot shows individual data points, each representing a specific instance with a corresponding target length and confidence level.
* **Target Length Distribution:** The density plot above the x-axis shows that most target lengths are clustered near 0, with a long tail extending to higher values.
* **Confidence Distribution:** The density plot to the right of the y-axis shows that confidence values are concentrated between 0.2 and 0.4.
* **Regression Line:** The regression line slopes upward, indicating a positive correlation between target length and confidence. The shaded area around the line represents the confidence interval.
### Key Observations
* **Positive Correlation:** There is a weak positive correlation between target length and confidence. As target length increases, confidence tends to increase slightly.
* **Clustering:** Most data points are clustered at low target lengths and low to moderate confidence levels.
* **Outliers:** There are a few data points with high target lengths and relatively high confidence.
### Interpretation
The chart suggests that in college mathematics, there is a slight tendency for confidence to increase with target length. However, the relationship is weak, and most instances involve short target lengths and moderate confidence. The clustering of data points at low target lengths indicates that many problems or tasks have short target lengths. The positive correlation could imply that students gain more confidence as they work on longer problems, or that longer problems are associated with concepts that students understand better. The presence of outliers suggests that some instances involve long target lengths and high confidence, possibly representing challenging but ultimately successful problem-solving experiences.