## Scatter Plot with Regression Line: College Mathematics Confidence vs. Target Length
### Overview
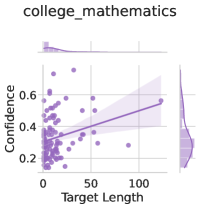
The image is a scatter plot with an overlaid linear regression line and its confidence interval. It visualizes the relationship between "Target Length" (x-axis) and "Confidence" (y-axis) for a dataset or model evaluation related to "college_mathematics". The plot includes marginal distributions (histograms/density plots) on the top and right edges.
### Components/Axes
* **Title:** `college_mathematics` (centered at the top).
* **Y-Axis:**
* **Label:** `Confidence`
* **Scale:** Linear, ranging from approximately 0.2 to 0.7.
* **Major Ticks:** 0.2, 0.4, 0.6.
* **X-Axis:**
* **Label:** `Target Length`
* **Scale:** Linear, ranging from 0 to approximately 130.
* **Major Ticks:** 0, 50, 100.
* **Legend:** Located in the top-left corner of the main plot area. It is partially obscured/cut off. Visible text includes:
* `Llama-2-70b` (associated with a purple color swatch).
* A second entry is partially visible, likely `Llama-2-13b` or similar, but cannot be confirmed.
* **Data Series:**
* **Scatter Points:** Numerous purple dots representing individual data points.
* **Regression Line:** A solid purple line showing the best linear fit.
* **Confidence Interval:** A semi-transparent purple shaded band around the regression line.
* **Marginal Plots:**
* **Top (above x-axis):** A density plot/histogram showing the distribution of `Target Length`. It is heavily right-skewed, with the highest density near 0.
* **Right (beside y-axis):** A density plot/histogram showing the distribution of `Confidence`. It appears roughly unimodal, centered around 0.3-0.4.
### Detailed Analysis
* **Data Distribution:**
* The vast majority of data points are clustered in the region where `Target Length` is between 0 and 50.
* `Confidence` values for these points range widely from ~0.2 to ~0.6, with a dense cluster between 0.2 and 0.4.
* There is a clear outlier point at approximately `Target Length = 120`, `Confidence = 0.58`.
* **Trend Verification:**
* The purple regression line has a positive slope, indicating a general trend where `Confidence` increases as `Target Length` increases.
* The line starts at approximately (0, 0.32) and ends near (120, 0.55).
* The shaded confidence interval widens as `Target Length` increases, indicating greater uncertainty in the trend estimate for longer target lengths due to sparse data.
* **Marginal Distributions:**
* The top marginal plot confirms the extreme right skew of the `Target Length` data; most samples have very short target lengths.
* The right marginal plot shows the `Confidence` scores are most frequently in the 0.3 to 0.4 range.
### Key Observations
1. **Sparse Data at High Values:** There are very few data points with a `Target Length` greater than 50, making the trend in that region less reliable.
2. **Positive but Noisy Correlation:** While the regression line suggests a positive relationship, the scatter of points is substantial, indicating a weak correlation. Many points with short target lengths have high confidence, and vice-versa.
3. **Notable Outlier:** The single point near (120, 0.58) is influential. It lies close to the regression line but is isolated, pulling the trend upward.
4. **Legend Ambiguity:** The legend is not fully legible, preventing definitive identification of the data series. The color and context suggest it may represent a specific model (e.g., Llama-2-70b) evaluated on college mathematics tasks.
### Interpretation
This chart likely evaluates the performance (measured by `Confidence`) of a language model (possibly Llama-2-70b) on college mathematics problems, plotted against the length of the expected answer or solution (`Target Length`).
The data suggests that **the model's confidence tends to be higher for problems requiring longer answers**, though the relationship is not strong. This could imply several things:
* Longer answers might be associated with more complex, multi-step problems where the model can "show its work," leading to higher calibrated confidence.
* Alternatively, the model might be overconfident on longer generations.
* The heavy skew towards short target lengths indicates the evaluation dataset is dominated by problems with concise answers (e.g., numerical results, short proofs).
The **primary anomaly** is the extreme sparsity of data for long target lengths. This makes the observed positive trend tentative. A robust conclusion would require more data points in the 50-130 range. The outlier at length ~120 is critical; without it, the slope of the regression line would likely be shallower.
**In summary:** The visualization hints at a potential positive link between answer length and model confidence in college mathematics, but the conclusion is limited by data imbalance and high variance. The key takeaway is the need for more evaluation examples with longer target sequences to validate the trend.