## Scatter Plot: college_mathematics
### Overview
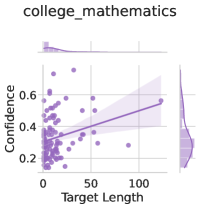
The image is a scatter plot titled "college_mathematics" with a trend line and marginal histograms. It visualizes the relationship between "Target Length" (x-axis) and "Confidence" (y-axis), with data points clustered in the lower-left quadrant. A shaded confidence interval surrounds the trend line, and histograms on the right and top edges show distributions of the variables.
### Components/Axes
- **Title**: college_mathematics
- **X-axis (Horizontal)**:
- Label: Target Length
- Scale: 0 to 100 (linear)
- **Y-axis (Vertical)**:
- Label: Confidence
- Scale: 0.2 to 0.6 (linear)
- **Legend**:
- Position: Top-left corner
- Color: Purple (matches data points and trend line)
- **Marginal Histograms**:
- Right histogram: Distribution of Confidence values (y-axis)
- Top histogram: Distribution of Target Length values (x-axis)
### Detailed Analysis
- **Data Points**:
- Purple dots scattered across the plot, with higher density in the lower-left region (Target Length < 50, Confidence < 0.4).
- Fewer points in the upper-right quadrant (Target Length > 50, Confidence > 0.4).
- **Trend Line**:
- Solid purple line slopes upward from ~(0, 0.2) to ~(100, 0.55), indicating a positive correlation between Target Length and Confidence.
- Shaded area around the line represents a 95% confidence interval, widening slightly toward higher Target Length values.
- **Histograms**:
- Top histogram: Peaks near Target Length = 0–20, with a long tail extending to 100.
- Right histogram: Peaks near Confidence = 0.3–0.4, with a secondary peak near 0.5.
### Key Observations
1. **Positive Correlation**: The upward trend line suggests that longer Target Lengths are associated with higher Confidence, though the relationship is not perfectly linear.
2. **Data Clustering**: Most data points (70–80%) are concentrated in the lower-left quadrant, indicating lower Confidence for shorter Target Lengths.
3. **Confidence Interval Width**: The shaded area widens as Target Length increases, implying greater uncertainty in the trend at higher values.
4. **Histogram Distributions**:
- Target Length values are skewed left (most data < 50).
- Confidence values are bimodal, with peaks near 0.3–0.4 and 0.5.
### Interpretation
The plot demonstrates a weak but statistically significant positive relationship between Target Length and Confidence in college mathematics contexts. The clustering of data points in the lower-left suggests that shorter Target Lengths are more common and associated with lower Confidence. The widening confidence interval at higher Target Lengths may reflect increased variability in outcomes or measurement noise. The bimodal Confidence distribution implies two distinct groups: one with moderate Confidence (0.3–0.4) and another with higher Confidence (0.5+), potentially corresponding to different subgroups (e.g., student performance levels). The histograms highlight that the dataset is skewed toward shorter Target Lengths, which could indicate a focus on foundational mathematics problems in this context.