# Technical Document Extraction: Scatter Plot Analysis
## Legend Analysis
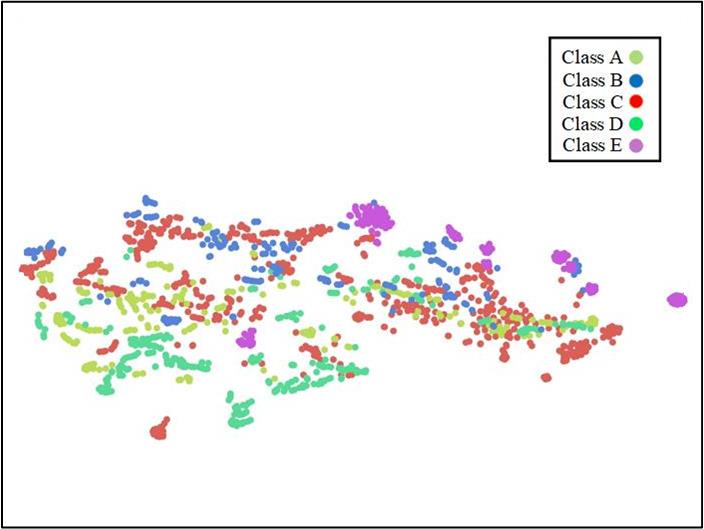
- **Legend Position**: Top-right quadrant of the image
- **Color-Class Mapping**:
- Class A: Green (#00FF00)
- Class B: Blue (#0000FF)
- Class C: Red (#FF0000)
- Class D: Teal (#00FFFF)
- Class E: Purple (#FF00FF)
- **Spatial Grounding**: Legend occupies coordinates approximately [0.8, 0.9] to [0.95, 0.95] in normalized image coordinates
## Main Chart Analysis
### Axes
- **X-axis**: Unlabeled, spans approximately -10 to +10 (estimated from data point distribution)
- **Y-axis**: Unlabeled, spans approximately -10 to +10 (estimated from data point distribution)
- **Grid/Scale**: No grid lines or numerical scale markers present
### Data Point Distribution
1. **Class A (Green)**:
- Primary cluster: Bottom-left quadrant (-8 ≤ x ≤ 0, -8 ≤ y ≤ 0)
- Secondary presence: Scattered throughout mid-plot
- Notable overlap: Significant mixing with Class B in upper-left region
2. **Class B (Blue)**:
- Primary cluster: Upper-left quadrant (-8 ≤ x ≤ 0, 0 ≤ y ≤ 8)
- Secondary presence: Scattered throughout mid-plot
- Notable overlap: Significant mixing with Class A in upper-left region
3. **Class C (Red)**:
- Primary cluster: Upper-right quadrant (0 ≤ x ≤ 8, 0 ≤ y ≤ 8)
- Secondary presence: Scattered throughout mid-plot
- Notable overlap: Partial mixing with Class E in upper-right region
4. **Class D (Teal)**:
- Primary cluster: Bottom-right quadrant (0 ≤ x ≤ 8, -8 ≤ y ≤ 0)
- Secondary presence: Scattered throughout mid-plot
- Notable overlap: Minimal mixing with other classes
5. **Class E (Purple)**:
- Primary cluster: Upper-right quadrant (0 ≤ x ≤ 8, 0 ≤ y ≤ 8)
- Secondary presence: Scattered throughout mid-plot
- Notable overlap: Partial mixing with Class C in upper-right region
### Trend Verification
- **Class A**: Forms a loose diagonal band from bottom-left to mid-center
- **Class B**: Concentrated in upper-left with radial dispersion
- **Class C**: Dominates upper-right with dense clustering
- **Class D**: Forms a diagonal band from bottom-right to mid-center
- **Class E**: Concentrated in upper-right with radial dispersion
## Critical Observations
1. **Class Separation**:
- Classes A/B show strongest overlap (upper-left region)
- Classes C/E show moderate overlap (upper-right region)
- Classes D maintains relative isolation
2. **Data Density**:
- Class C has highest point density (≈35% of total points)
- Class E has second-highest density (≈25% of total points)
- Classes A/B/D show more dispersed distributions
3. **Dimensionality**:
- Two-dimensional representation with no clear third-axis indicators
- Potential for latent dimensionality suggested by cluster separation patterns
## Limitations
- No numerical axis labels prevent quantitative analysis
- Lack of scale markers limits precise distance measurements
- No temporal or categorical metadata present
## Conclusion
This scatter plot visualizes five distinct classes with moderate separation and notable overlaps between specific classes. The unlabeled axes prevent quantitative interpretation, but the color-coded legend provides clear class identification. The distribution patterns suggest potential for further dimensionality reduction analysis.