## Diagram: Tree Transformation
### Overview
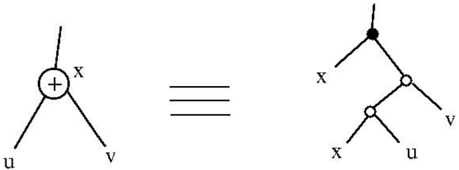
The image presents a diagram illustrating a transformation of a tree structure. On the left, a tree with a node represented by a circle containing a plus sign is shown. This is equivalent to a more complex tree structure on the right, which involves nodes represented by filled and unfilled circles. The diagram demonstrates how a single node operation can be decomposed into a more detailed tree structure.
### Components/Axes
* **Left Tree:**
* Root Node: A circle with a "+" sign inside, labeled "x" to the right.
* Child Nodes: Two nodes labeled "u" and "v" connected to the root node.
* Edges: Lines connecting the nodes.
* **Equality Symbol:** Three horizontal lines indicating equivalence.
* **Right Tree:**
* Top Node: A filled circle.
* Second Level Nodes: One node labeled "x" connected to the top node. Another node (unfilled circle) connected to the top node.
* Third Level Nodes: One node labeled "v" connected to the unfilled circle. Another node (unfilled circle) connected to the unfilled circle.
* Bottom Nodes: Two nodes labeled "x" and "u" connected to the unfilled circle.
* Edges: Lines connecting the nodes.
### Detailed Analysis or Content Details
The left side of the diagram shows a tree with a root node that performs an addition operation (indicated by the "+" sign). This node has two children, labeled "u" and "v". The right side of the diagram shows an equivalent tree structure. The top node is a filled circle, which could represent a specific operation or state. This node has two children: one labeled "x" and another represented by an unfilled circle. The unfilled circle node further branches into "v" and another unfilled circle, which then branches into "x" and "u".
### Key Observations
* The transformation replaces a single node operation (addition) with a more complex tree structure.
* The filled and unfilled circles likely represent different types of operations or states within the tree.
* The labels "x", "u", and "v" represent variables or values being processed by the tree.
### Interpretation
The diagram illustrates a transformation or decomposition of an operation within a tree structure. The addition operation on the left is replaced by a more detailed tree on the right, which likely represents a series of operations or states. The filled and unfilled circles likely represent different types of operations or states, and the labels "x", "u", and "v" represent the data being processed. This type of transformation could be used to optimize or simplify complex operations within a tree-based system.