## Scatter Plot: Principal Component Analysis of Token "3"
### Overview
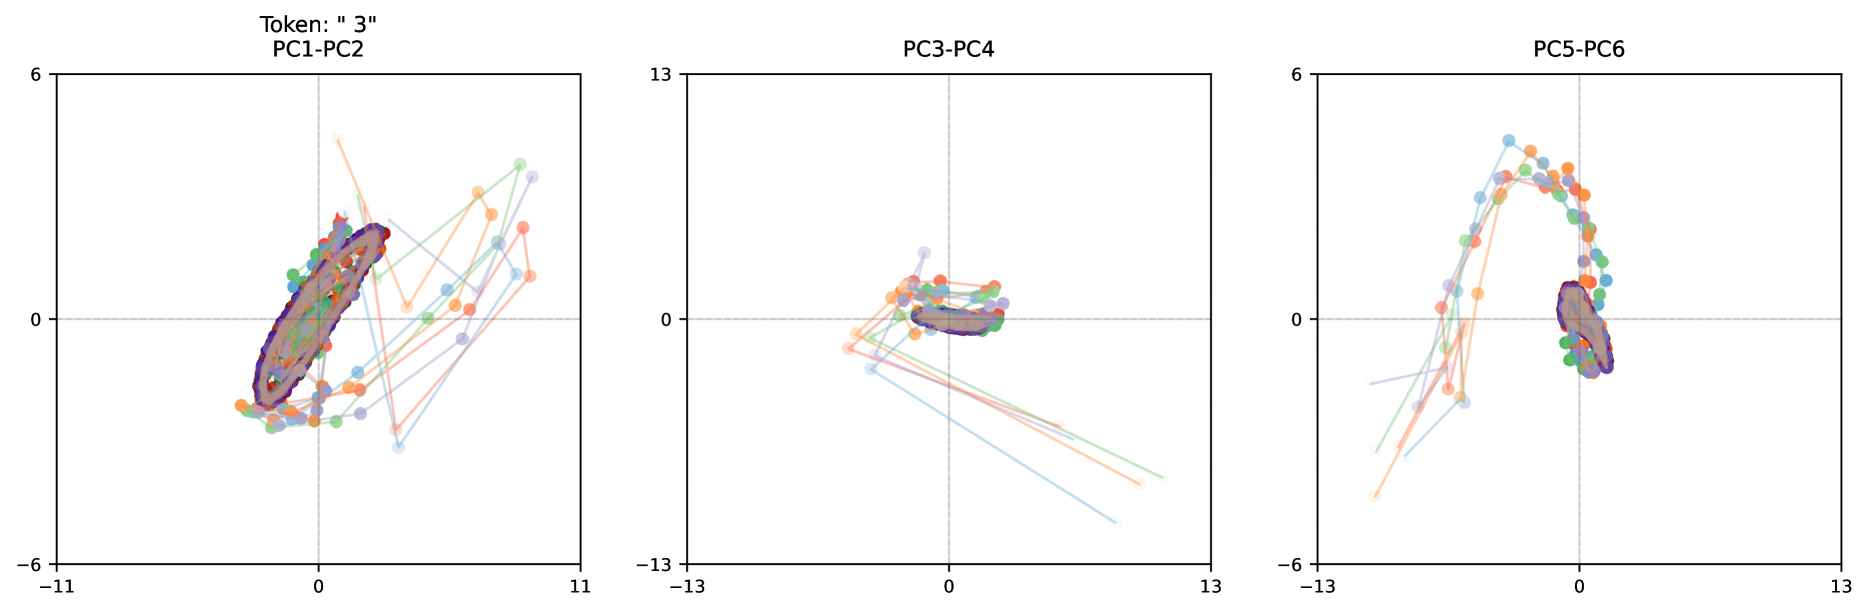
The image presents three scatter plots, each displaying the relationship between two principal components (PCs) for a token labeled "3". The plots show trajectories of data points, with each trajectory represented by a different colored line. The plots are arranged horizontally, showing PC1-PC2, PC3-PC4, and PC5-PC6 respectively. Each plot also contains a central cluster of points, possibly representing a stable state or average position.
### Components/Axes
* **Titles:**
* Top-left plot: "Token: " 3" PC1-PC2"
* Top-center plot: "PC3-PC4"
* Top-right plot: "PC5-PC6"
* **Axes:**
* Left plot (PC1-PC2):
* X-axis (PC1): Ranges from -11 to 11, with a gridline at 0.
* Y-axis (PC2): Ranges from -6 to 6, with a gridline at 0.
* Center plot (PC3-PC4):
* X-axis (PC3): Ranges from -13 to 13, with a gridline at 0.
* Y-axis (PC4): Ranges from -13 to 13, with a gridline at 0.
* Right plot (PC5-PC6):
* X-axis (PC5): Ranges from -13 to 13, with a gridline at 0.
* Y-axis (PC6): Ranges from -6 to 6, with a gridline at 0.
* **Data Points:** Each plot contains multiple trajectories represented by lines connecting data points. The data points are colored, but there is no explicit legend provided. The colors appear to be:
* Light Blue
* Orange
* Green
* Purple
* Light Orange
* Light Purple
* **Central Cluster:** Each plot has a dense cluster of points near the origin (0,0), surrounded by a dark purple outline.
### Detailed Analysis
* **PC1-PC2 Plot:**
* Trajectories start from various locations and converge towards the central cluster.
* The central cluster is roughly elliptical, centered around (0,0), with a major axis oriented diagonally from bottom-left to top-right.
* X-axis ranges from approximately -11 to 11.
* Y-axis ranges from approximately -6 to 6.
* **PC3-PC4 Plot:**
* Trajectories start from more dispersed locations compared to the PC1-PC2 plot.
* The central cluster is smaller and more concentrated around (0,0).
* X-axis ranges from approximately -13 to 13.
* Y-axis ranges from approximately -13 to 13.
* **PC5-PC6 Plot:**
* Trajectories exhibit a curved pattern, starting from the bottom and moving upwards towards the central cluster before dispersing again.
* The central cluster is similar in size and shape to the PC3-PC4 plot.
* X-axis ranges from approximately -13 to 13.
* Y-axis ranges from approximately -6 to 6.
### Key Observations
* The central clusters in all three plots suggest a stable state or equilibrium point for the token "3" in the reduced-dimensional space defined by the principal components.
* The trajectories represent the movement or evolution of the token's state over time or under different conditions.
* The PC1-PC2 plot shows a more elongated cluster, indicating a stronger correlation or relationship between these two principal components compared to the other pairs.
* The PC5-PC6 plot exhibits a distinct curved pattern, suggesting a non-linear relationship between these components.
### Interpretation
The plots visualize the behavior of a token "3" in a reduced-dimensional space defined by principal component analysis. The trajectories represent the token's movement or evolution, and the central clusters indicate stable states. The differences in the shapes and patterns of the trajectories and clusters across the three plots suggest that different pairs of principal components capture different aspects of the token's dynamics.
The convergence of trajectories towards the central clusters implies that the token tends to return to a stable state, possibly representing a characteristic or average configuration. The dispersion of trajectories away from the clusters indicates deviations from this stable state, potentially caused by external factors or internal variability.
The PC1-PC2 plot shows a more elongated cluster, suggesting a stronger correlation or relationship between these two principal components compared to the other pairs. This could indicate that PC1 and PC2 are more important or influential in determining the token's behavior.
The PC5-PC6 plot exhibits a distinct curved pattern, suggesting a non-linear relationship between these components. This could indicate that the token's behavior is more complex or nuanced in the space defined by PC5 and PC6.